

Lead exposure in children rarely announces itself. There is usually no illness to observe, no symptom to report, and no moment at which a parent or a doctor would think to investigate. The harm that concerns public health bodies today is not acute poisoning. It is a small, invisible shift in how a developing brain forms, one that becomes legible only later and only across large numbers of children at once.
That is what makes lead unusual among environmental contaminants, and it is why the evidence is often misread in both directions. Overstated, it becomes a claim that lead determines a child’s intelligence. Understated, it becomes a reassurance that low-level exposure does not matter. Neither survives contact with the research.
This article sets out what the evidence actually supports: how lead reaches and affects the developing brain, what the dose-response relationship looks like and where it is contested, why small average changes matter at population scale, and what the United Kingdom’s own cohort studies have and have not demonstrated.
Table of Contents
Key Facts
| Issue | What it means |
| No defined safe threshold in children | Harm may occur at any measurable level of exposure. |
| Strongest UK cohort evidence | Behaviour and educational attainment, rather than measured IQ. |
| Dose-response shape | Described as supra-linear, with proportionally greater effect at low exposure. The shape is debated on statistical grounds. |
| UK intervention concentration | Lowered from 10µg/dL to 5µg/dL for children under 16 and pregnant women from 5 July 2021. |
| What 5µg/dL means | An action threshold for public health involvement, not a level below which harm stops. |
| Most vulnerable groups | Unborn babies, infants and children under six. |
Why IQ and behaviour are the measures used
Lead affects multiple aspects of neurodevelopment. Research has concentrated on three families of outcome: cognitive ability, usually measured as IQ; behaviour, particularly attention, impulsivity and externalising conduct; and educational attainment, measured through school assessment.
These are not the only things lead affects. They are the things that can be measured consistently, in large numbers, across decades and across countries. That comparability is what makes population-level analysis possible at all.
There is a second reason IQ dominates the literature, and it is worth being explicit about. IQ is used here as a population-health measure, not an individual-diagnosis measure. No clinician diagnoses a child with lead-related cognitive loss in the way they might diagnose acute poisoning. The question the research asks is what happens to a cohort of children collectively when average exposure shifts. That is a different question from what happens to any particular child, and it has a different kind of answer.
How lead reaches and affects the developing brain
Lead has no biological function. It interferes with development largely because it resembles calcium closely enough to disrupt the cellular machinery that depends on it.
Calcium governs neurotransmitter release, cell signalling, and the pruning of synaptic connections through which a young brain refines its structure. Lead ions are sufficiently similar in size and charge to intrude on those processes, affecting how neurons communicate and how the developing brain organises itself.
Several factors concentrate this risk in early childhood. The blood-brain barrier is less developed in infants, admitting more lead. Children absorb a substantially larger proportion of ingested lead than adults, commonly estimated at around 40 to 50 per cent and several times the adult figure.[3] And this occurs during the most rapid phase of structural brain development. Normal hand-to-mouth behaviour adds a further route that older children and adults do not share.
Exposure is also not confined to a single window. A substantial proportion of absorbed lead is eventually stored in bone, where it can persist for years and release slowly back into the bloodstream. Maternal exposure, including exposure predating a pregnancy, can therefore reach a developing foetus as stored bone lead mobilises during pregnancy and lactation.
The mechanism matters because it predicts where the effects should appear. The behavioural signal in the research clusters around attention, impulse control and behavioural regulation, which are the functions that depend on precisely the cognitive-control systems the mechanism implicates.
The dose-response relationship
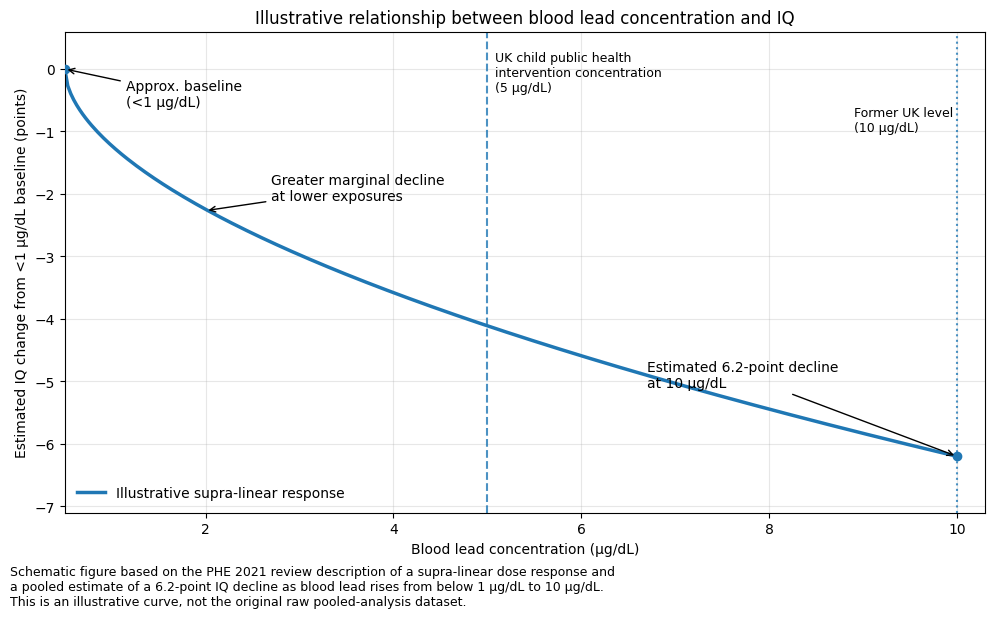
Public Health England’s 2021 review, Evaluation of whether to lower the public health intervention concentration for lead exposure in children, describes lead as a non-threshold contaminant. Adverse effects may occur at any level of exposure, with no floor below which risk disappears.[1]
The review found strong evidence of adverse effects on cognitive function below 5µg/dL, and evidence of externalising behaviours including attention, impulsivity and hyperactivity below 10µg/dL.[1]
More counterintuitively, the relationship is generally described as supra-linear: the damage per unit of lead appears proportionally greatest at the lowest exposures, not the highest. The pooled analysis underpinning this, Lanphear and colleagues (2005), is cited in the PHE review as estimating an IQ decline of around 6.2 points across the range from below 1µg/dL to 10µg/dL.[1,4] That is a range which, until relatively recently, would have attracted no public health attention at all.
A caveat worth stating. The supra-linear shape has been questioned on statistical grounds. Some analyses argue that the steeper apparent effect at low exposure could partly reflect the interaction between a log-normal distribution of blood lead concentrations and a roughly normal distribution of test scores, rather than a purely biological phenomenon. The mainstream interpretation, supported by spline modelling and by studies that stratify by exposure band, is that the steeper low-level effect is real. But the curve is not beyond question, and it is more honest to say so than to present it as settled.
The practical conclusion does not depend on resolving that debate. Whether the curve is supra-linear or simply linear without a threshold, the implication for policy is the same.
Why small average shifts matter
This is the part of the picture most often misread, because it appears to contradict common sense. If average population exposure falls and average test scores rise by a point or two, the effect looks negligible. A couple of points, spread across millions of children, changes nothing anyone would notice.
But population outcomes are distributed across a curve, and a small movement in the middle of that curve produces a disproportionate change at the edges. Shift the whole distribution slightly and the number of children falling below a fixed threshold, such as the point at which learning difficulty is identified or additional educational support is triggered, changes by considerably more than the shift in the average would suggest.
The logic runs in both directions. A small population-wide increase in exposure would not produce obvious clinical cases in most children. It would increase how many children sit in the lowest-scoring bands.
This is why public health bodies treat small average changes in blood lead as significant when no individual case looks dramatic. The cost is not visible in any single child’s result. It is visible in the shape of a generation’s outcomes.
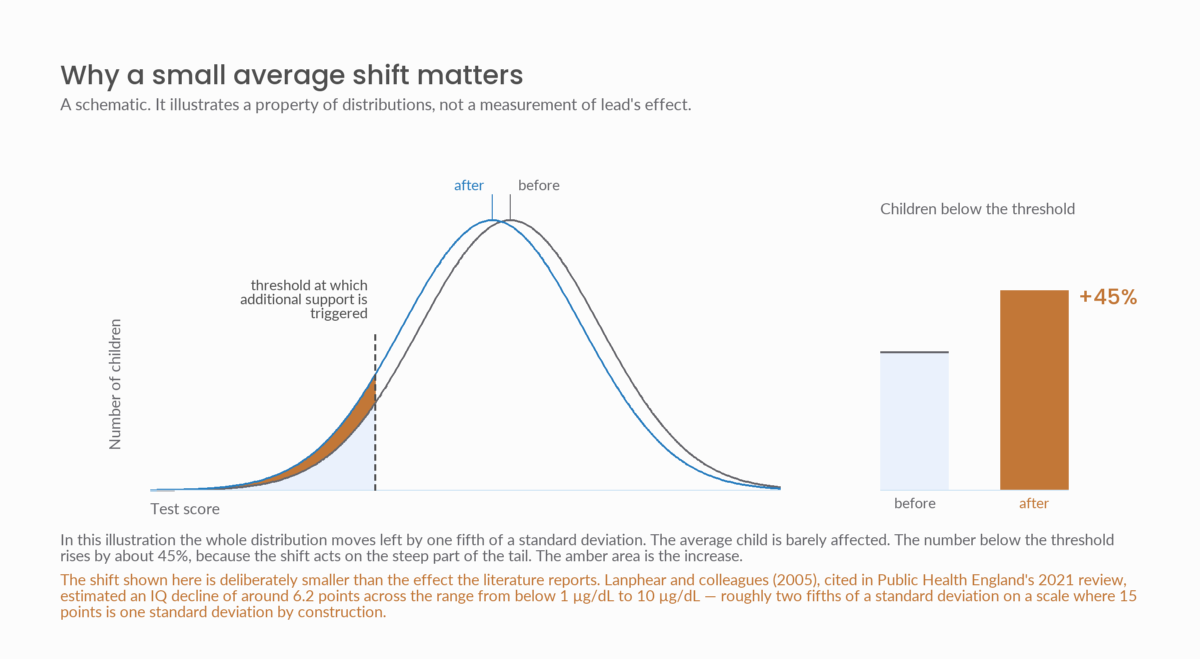
Figure 1. A schematic, not a measurement. Population outcomes are distributed across a curve, and a small movement in the middle produces a disproportionate change at the edges. This is why public health bodies treat small average changes in blood lead as significant when no individual case looks dramatic. No axis values are given because none are being claimed: the curve shape, the size of the shift and the position of the threshold are all chosen for illustration.
What the UK evidence actually shows
Two British studies carry most of the weight here, and reading them together produces a more precise conclusion than either does alone.
Edinburgh: behaviour. The Edinburgh Lead Study assayed blood lead in 855 children across 18 primary schools, analysing a sub-sample of 501 aged six to nine. Behaviour was assessed using the Rutter scales completed by both teachers and parents, with adjustment for 30 potential confounding variables.[5]
After adjustment, blood lead was significantly associated with teacher-rated total behaviour problems, aggressive and anti-social behaviour, and hyperactivity. It was not significantly associated with the neurotic sub-score covering anxious or withdrawn behaviour, so the effects appeared in conduct and regulation rather than general distress. The authors reported a dose-response relationship with no evidence of a threshold, and children in the highest blood lead group had around 2.4 times the odds of falling into a worse behaviour category.[5]
Two features strengthen this. The participating families were not deprived: 43 per cent were in social class I or II and 85 per cent were owner-occupiers. And the authors addressed reverse causation directly. A child can increase their own exposure to dust or soil through behaviour, but cannot alter the lead concentration in water coming from the kitchen tap.
Two features qualify it. The sub-sample was deliberately weighted toward the top quartile of the blood lead distribution, so its mean of 10.4µg/dL describes the study group rather than the average Edinburgh child. And the authors noted that the relationship appeared to be driven substantially by the highest-exposure group. The full study is covered in our article on the Edinburgh Lead Study.
ALSPAC: attainment, and a null result on IQ. The Avon Longitudinal Study of Parents and Children measured venous blood lead at around 30 months in 582 children, with a mean of 4.22µg/dL and a median of 3.31µg/dL. More than a quarter, 26.6 per cent, were at or above 5µg/dL.[6]
Chandramouli and colleagues (2009) linked those measurements to national assessment results at ages seven to eight. Children with blood lead between 5 and 10µg/dL had roughly half the odds of reaching the expected standard in reading and writing compared with children in the lowest group, after adjustment for a detailed set of confounders including the child’s IQ, maternal education and smoking, paternal socioeconomic status, home ownership, family adversity and parenting attitudes. Across the full sample, a doubling of blood lead was associated with a 0.3-point decline in assessment grades.[6]
Teacher-rated behavioural findings pointed the same way as Edinburgh. At blood lead above 10µg/dL, children showed markedly elevated rates of teacher-rated hyperactivity, total difficulties and antisocial behaviour. Parent-rated equivalents were not statistically significant.[6]
On IQ specifically, ALSPAC did not find what is often assumed. The principal ALSPAC paper on IQ examined prenatal exposure, comparing maternal blood lead in pregnancy against child IQ at ages four and eight, and the adjusted models were largely null. Maternal education was the strongest variable attenuating the crude association. A sex-specific result emerged that ran contrary to toxicological expectation and which the authors treated cautiously.[7] The full analysis is set out in our article on Children of the 90s.
The British evidence is strongest on behaviour, not IQ
The defensible UK position is narrower and stronger than the claim that lead lowers IQ.
The international pooled literature, which drives the dose-response curve used in policy, is built substantially on IQ. The British cohort evidence is strongest not on measured IQ but on behaviour and educational attainment: what lead does to how children conduct themselves and how they learn, observed in classrooms and in national assessments.
That is not a weaker finding. Reading and writing attainment at ages seven to eight is arguably a more consequential outcome than a test score, and the ALSPAC associations appeared below the threshold that governed clinical concern at the time. But it means any account of this evidence that leads with IQ is leading with the part the UK data supports least well.
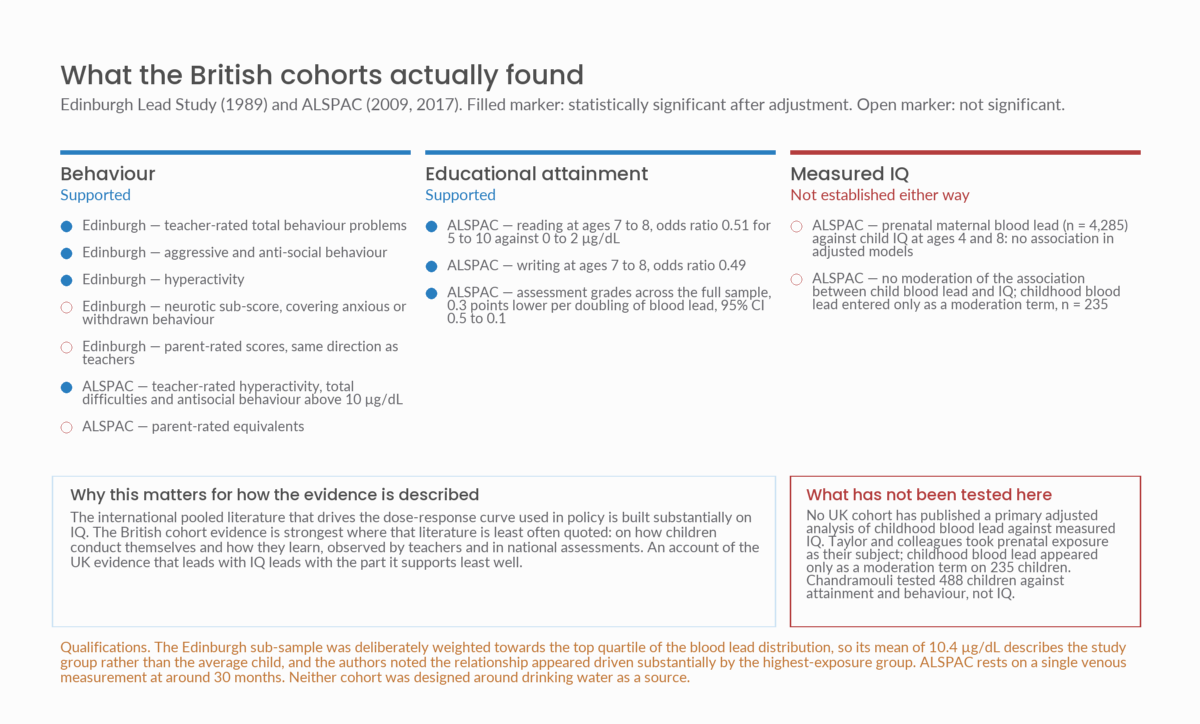
Figure 2. What the British cohorts actually found. The behaviour and attainment associations rest on childhood blood lead measured at around 30 months in 488 children. The ALSPAC IQ analysis took prenatal maternal blood lead as its exposure and was null in adjusted models; childhood blood lead entered it only as a moderation term on a subsample of 235.
Where UK guidance sits
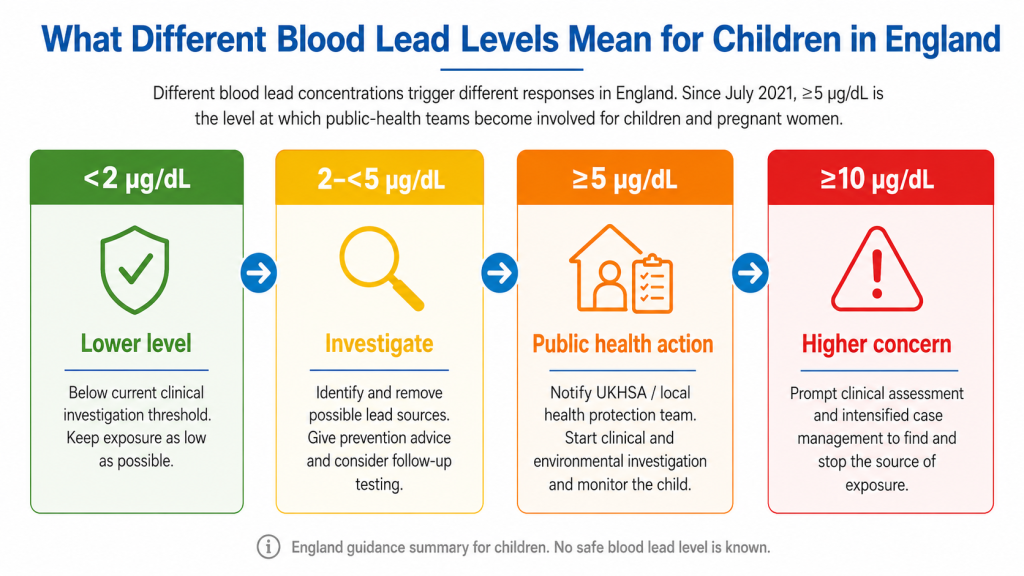
Before 2021, the public health intervention concentration for children in England was 10µg/dL. Following the PHE review it was lowered to 5µg/dL, equivalent to 0.24µmol/L, for children under 16 and pregnant women, with effect from 5 July 2021.[1,2] A range above 2µg/dL and below 5µg/dL is widely accepted in the UK as warranting investigation and source identification.
The essential point is that 5µg/dL is an action threshold, not a safety threshold. It marks where formal public health involvement begins, not where harm starts. The change reflected improved understanding of where effects occur, not rising exposure.
Other bodies sit lower still. The United States Centers for Disease Control and Prevention uses a blood lead reference value of 3.5µg/dL, again a surveillance tool rather than a safe level.[9] The World Health Organization states that no safe blood lead concentration has been identified in children, and that concentrations as low as 3.5µg/dL may be associated with reduced intelligence, behavioural difficulties and learning problems.[8]
Lower thresholds do not make lead safer. They reflect evidence that harm occurs lower than previously recognised. The same logic applies to the drinking-water limit, which is a separate measurement on a separate basis, and is examined in our article on the 10 microgramme limit.
Limitations
Three qualifications belong with the account above.
The dose-response shape is contested. The supra-linear curve has been questioned on statistical grounds, and while the mainstream interpretation supported by spline modelling is that the steeper low-level effect is real, it is not settled. The practical conclusion does not depend on resolving it.
Neither British cohort was designed around drinking water. Edinburgh measured water and dust together and apportioned between them; ALSPAC measured blood lead without attributing it to a source. Nothing here establishes what share of these children’s exposure came from their taps.
Both cohorts have structural limits. The Edinburgh sub-sample was deliberately weighted towards the top quartile of the blood lead distribution, so its mean of 10.4µg/dL describes the study group rather than the average child, and the authors noted the relationship appeared driven substantially by the highest-exposure group. ALSPAC rests on a single venous measurement at around 30 months, which may not represent cumulative exposure across the windows that matter. Both are observational, so residual confounding remains live: lead exposure clusters with older housing, poorer environmental conditions and wider socioeconomic disadvantage.
A fourth point concerns what the IQ evidence actually rests on. Taylor and colleagues took prenatal maternal blood lead as the exposure, measured in 4,285 women at a median gestational age of 11 weeks, and tested it against child IQ at four and eight.[7] Adjusted models found no association, and no moderation of the association between child blood lead and IQ. Childhood blood lead entered that analysis only as a moderation term, on the 235 children with a 30-month sample.[7]
The practical consequence is narrow but worth stating. No UK cohort has published a primary adjusted analysis of childhood blood lead against measured IQ. Chandramouli’s 488 children were tested against attainment and behaviour.[6] Taylor’s IQ analysis was designed around a different exposure window. The internationally established association between childhood lead exposure and cognitive deficit — which Taylor and colleagues themselves describe as well established — rests on evidence from elsewhere, not on British cohort data.
What follows from this
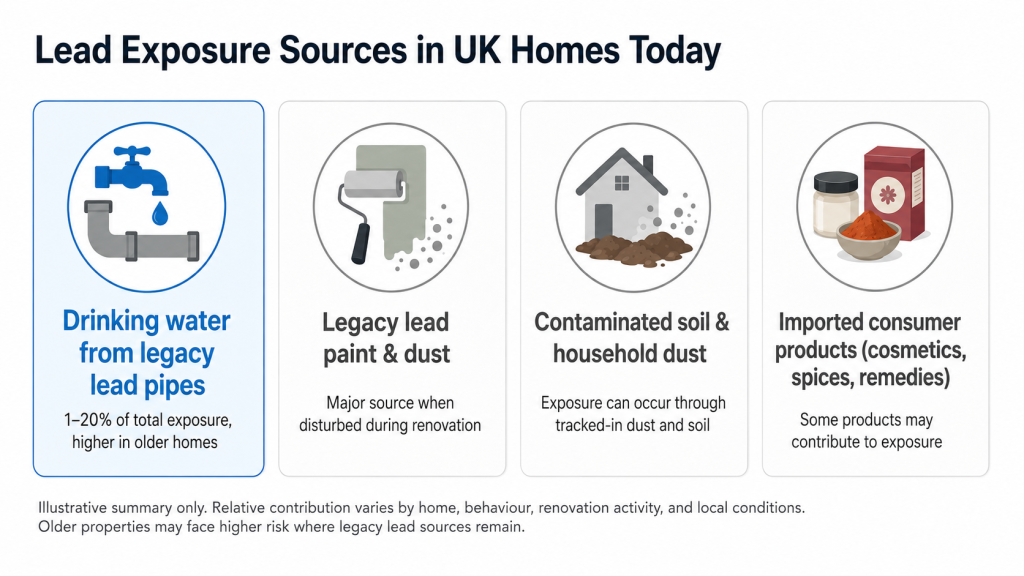
Because there is no identified safe level, the logic of the response is preventive rather than diagnostic. The question is not whether a child’s exposure has crossed a line, but whether an identifiable source exists and can be removed.
That shifts attention to where exposure originates. Lead reaches children through several routes: deteriorating paint and paint dust, contaminated soil and household dust, imported consumer products, occupational exposure carried home, and drinking water where lead pipework, solder or fittings remain in contact with the supply.
Those pathways, and what can be done about them, are covered in detail elsewhere on this site:
- Lead in drinking water and blood lead concentrations — the epidemiological evidence linking water lead to measured biological exposure, and what intervention studies show about reversibility
- London’s older housing and legacy lead water pipes — why housing age acts as a risk indicator, and how to establish whether lead pipework is present in a specific property
- Lead exposure and ADHD — the evidence on attention and hyperactivity outcomes in detail
- Lead exposure and violent crime in Scotland — the historical Scottish record and the lead-crime hypothesis
- From plumbosolvency control to lead replacement — UK and international policy on removing lead from drinking-water systems
References
- Public Health England (2021). Evaluation of whether to lower the public health intervention concentration for lead exposure in children. Report by the lead intervention concentration working group.
- UK Health Security Agency. Lead: environmental and public health intervention. Guidance on blood lead intervention concentrations and investigation thresholds.
- UK Health Security Agency. Lead: toxicological overview.
- Lanphear, B. P. et al. (2005). Low-level environmental lead exposure and children’s intellectual function: an international pooled analysis. Environmental Health Perspectives, 113(7), 894–899.
- Thomson, G. O. B., Raab, G. M., Hepburn, W. S., Hunter, R., Fulton, M. and Laxen, D. P. H. (1989). Blood-lead levels and children’s behaviour: results from the Edinburgh Lead Study. Journal of Child Psychology and Psychiatry, 30(4), 515–528.
- Chandramouli, K., Steer, C. D., Ellis, M. and Emond, A. M. (2009). Effects of early childhood lead exposure on academic performance and behaviour of school age children. Archives of Disease in Childhood, 94(11), 844–848.
- Taylor, C. M., Kordas, K., Golding, J. and Emond, A. M. (2017). Effects of low-level prenatal lead exposure on child IQ at 4 and 8 years in a UK birth cohort study. Neurotoxicology, 62, 162–169.
- World Health Organization. Lead poisoning. Fact sheet.
- Centers for Disease Control and Prevention. Blood lead reference value.
Disclosure
This article is published by London & Surrey Water Services Ltd, a CIPHE member and WaterSafe registered contractor whose business includes lead pipe replacement. The company therefore has a commercial interest in the subject matter. The article is restricted to findings and positions reported in the sources cited, and no claim is made here that is not traceable to those sources. It is not medical advice. Readers concerned about lead exposure should speak to their GP, and readers concerned about lead in their own water supply should contact their water supplier or seek independent laboratory testing.