
Abstract
Lead exposure remains a major environmental health concern despite the widespread removal of lead from petrol, paint and many industrial products during the late twentieth century. Drinking water continues to represent an important and preventable source of exposure wherever lead-bearing plumbing remains in service. This review examines the epidemiological evidence linking lead concentrations in drinking water with blood lead concentrations, drawing together observational studies, intervention studies, engineering investigations and contemporary public-health guidance.
Evidence accumulated over more than five decades demonstrates a consistent relationship between elevated lead concentrations in drinking water and increased blood lead concentrations where lead service lines, communication pipes, customer-side supply pipes or internal lead plumbing remain present. Intervention studies further demonstrate that reducing lead concentrations in drinking water results in measurable reductions in blood lead, strengthening the evidence beyond simple observational association. Although the magnitude of the relationship varies according to plumbing configuration, water chemistry, individual behaviour and competing environmental lead sources, the overall direction of the association has remained remarkably consistent across countries, populations and study designs.
The evidence reviewed indicates that drinking water should be regarded as a significant and preventable contributor to blood lead concentrations wherever lead-bearing plumbing exists, and that reducing drinking-water lead reduces the biological burden of lead. Contemporary international public-health guidance reflects this interpretation.
A note on units: blood lead concentrations are reported in the units used by each original study. Values expressed as µg/100 mL are numerically identical to µg/dL; values expressed as µg/L are ten times the corresponding µg/dL figure.
Table of Contents
Introduction
Lead remains one of the most extensively studied environmental toxicants because of its persistence, widespread historical use and well-established effects on human health. Although major reductions in environmental lead exposure have been achieved through the removal of lead from petrol, paint and numerous industrial products, legacy infrastructure continues to expose millions of people worldwide. Among the remaining environmental pathways, drinking water has attracted increasing scientific attention because contamination originates not from the treated water itself but from contact with lead-bearing plumbing during distribution and within individual properties.
Unlike microbiological contamination or naturally occurring chemical contaminants, lead is rarely present in treated water leaving modern treatment works. Instead, it enters drinking water after treatment through lead communication pipes, customer-side supply pipes, internal plumbing, lead-containing solder, brass fittings and, historically, lead storage tanks [7, 37]. The extent of contamination depends upon water chemistry, plumbing configuration, corrosion processes and water use, resulting in considerable variation in lead concentrations between individual properties supplied by the same distribution network [25].
The contribution of drinking water to overall lead exposure has been debated for more than fifty years. Blood lead concentration reflects cumulative exposure from multiple environmental sources including household dust, deteriorating lead-based paint, contaminated soil, food, occupational exposure and drinking water [15, 24]. Consequently, determining the specific contribution of drinking water requires careful epidemiological investigation combining environmental sampling with biological monitoring.
The United Kingdom played a pivotal role in developing this evidence base. During the 1970s and 1980s, naturally soft, acidic water supplies combined with widespread lead plumbing created conditions under which drinking water became a major source of exposure in some populations [19, 22]. Large-scale epidemiological investigations undertaken in Scotland and elsewhere demonstrated significant associations between lead concentrations in drinking water and blood lead concentrations, while subsequent corrosion-control programmes provided some of the earliest natural experiments showing that reducing lead concentrations in drinking water resulted in measurable reductions in blood lead [20, 21].
Over subsequent decades, observational studies, intervention studies and engineering investigations undertaken in Europe, North America and elsewhere have substantially expanded this evidence. Advances in corrosion science have explained the mechanisms governing lead release from plumbing materials [34, 37], while developments in toxicology and public health have demonstrated adverse effects at blood lead concentrations considerably lower than those previously recognised [5, 13, 15]. Together, these disciplines have transformed understanding of drinking water from a suspected source of lead exposure into a recognised and preventable environmental pathway.
The evidence relevant to this question is, however, distributed across disciplines that rarely publish together. Epidemiological studies establish the association between exposure and internal dose; corrosion science explains the physical mechanism producing that exposure; regulatory guidance translates both into practice. Each literature tends to cite within itself. This review is constructed to be read across those boundaries: it evaluates the epidemiological relationship using the conventional criteria for causal inference, and treats engineering and regulatory evidence not as background but as load-bearing components of the argument. It also gives sustained attention to the United Kingdom evidence base, which is frequently cited in summary but rarely examined in the detail its historical importance warrants.
Accordingly, this review synthesises evidence from observational studies, intervention studies, natural experiments and engineering investigations to evaluate the consistency, strength, dose–response characteristics and biological plausibility of the association. Particular emphasis is placed upon the United Kingdom, while international evidence is considered throughout to determine whether similar relationships have been observed across different environmental and regulatory settings.
Blood lead as the measure of human exposure
Blood lead concentration is the principal biomarker used to assess human exposure to lead. Unlike environmental measurements, which estimate potential exposure, blood lead directly measures lead that has entered the body from all sources, and has become the foundation of epidemiological research, clinical investigation and public-health surveillance [1, 5, 13].
Following ingestion, absorbed lead enters the bloodstream before distribution to soft tissues and, ultimately, bone, the body’s principal long-term storage site [15]. Because lead remains in blood for only a short period compared with bone, blood lead primarily reflects recent or continuing exposure rather than cumulative lifetime burden. This makes it particularly suitable for investigating drinking-water exposure, where changes in the environment can be detected through corresponding changes in the biomarker [20, 28].
Children absorb a substantially greater proportion of ingested lead than adults [9, 15]. Pregnancy also increases the importance of blood lead, because physiological changes may mobilise previously stored skeletal lead and contribute to fetal exposure. Infants, young children and pregnant women have therefore become the principal focus of public-health intervention [1, 4].
Contemporary public-health organisations, including the World Health Organization, UK Health Security Agency and US Centers for Disease Control and Prevention, acknowledge that no blood lead concentration has been identified at which adverse health effects can be confidently excluded [1, 3, 5, 13].[2,14] Blood lead intervention levels therefore represent public-health action thresholds rather than biological safety thresholds; the current CDC blood lead reference value is 3.5 µg/dL [13]. This distinction between action threshold and safety threshold is fundamental to interpreting the evidence reviewed below.
Lead in drinking water
Lead contamination of drinking water differs fundamentally from most other drinking-water contaminants because it originates primarily within the distribution system and domestic plumbing rather than at the treatment works. Modern treatment processes remove naturally occurring metals before water enters the distribution network, meaning that treated water usually contains little or no lead. Contamination occurs as water passes through lead-bearing materials before reaching the consumer’s tap [6, 7].
Lead was historically favoured because it was durable, easily worked and resistant to external corrosion, and lead communication pipes, customer-side supply pipes and internal plumbing remained standard across much of Europe and North America until the second half of the twentieth century. Installation of new lead plumbing is now prohibited or severely restricted in most of these countries, but large quantities of legacy infrastructure remain in service [7, 10].
Lead enters drinking water through corrosion processes collectively described as plumbosolvency, governed principally by pH, alkalinity and dissolved inorganic carbon [34, 35, 37]. It may be present as dissolved lead released gradually from pipe surfaces, or as particulate lead generated when corrosion scales are disturbed by hydraulic changes, maintenance or partial pipe replacement [43, 44, 45]. Concentrations therefore vary considerably between neighbouring properties supplied from the same water main, and even between repeated samples from the same property [25]. These determinants are examined in Section 5.
Human exposure depends upon more than concentration alone. Plumbing configuration, pipe length, water consumption, flushing behaviour, preparation of infant formula and alternative environmental lead sources all influence the contribution drinking water makes to blood lead.1 These factors explain much of the variability observed within epidemiological studies and demonstrate why the relationship is inherently context-dependent.
Epidemiological evidence linking drinking water and blood lead
4.1 Early recognition of drinking water as a source of lead exposure
During the 1970s, epidemiological investigations began to identify drinking water as a potentially important source of environmental lead exposure. Earlier research had focused primarily on occupational exposure, lead-based paint and industrial emissions, with comparatively little attention given to drinking water. Improvements in analytical methods, however, enabled investigators to measure lead accurately in both household drinking water and blood, making it possible to examine the relationship directly.
Early studies showed that populations supplied through naturally soft, acidic waters frequently exhibited substantially higher drinking-water lead concentrations than populations supplied through harder waters [22, 35]. The variation closely reflected differences in plumbing materials and water chemistry, suggesting that contamination originated primarily within domestic plumbing rather than at treatment works. These observations provided the foundation for the more detailed investigations undertaken during the late 1970s and early 1980s.
4.2 The United Kingdom evidence base
The United Kingdom provides one of the strongest and most comprehensive bodies of evidence linking drinking-water lead with blood lead concentrations. Extensive use of lead plumbing, naturally plumbosolvent water supplies and large-scale engineering interventions created ideal conditions for examining both exposure and its reduction.
One of the earliest investigations was undertaken in Ayr, Scotland, where Sherlock and colleagues examined populations supplied through highly plumbosolvent water [19]. They demonstrated significant associations between drinking-water lead and blood lead among adults and children. Bottle-fed infants were identified as particularly vulnerable, because formula prepared using contaminated tap water substantially increased lead intake.
The subsequent introduction of corrosion-control treatment provided one of the earliest natural experiments in environmental epidemiology. Treatment of the Ayr supply to reduce plumbosolvency began in 1981, and water and blood lead were measured before and after, largely in the same dwellings and the same women. Water treatment produced a sharp fall in water lead concentrations and a decrease in median blood lead from 21 to 13 µg/100 mL [20]. Two participants recorded higher blood lead concentrations than expected; both had been removing old paint, illustrating how competing sources can be identified and accounted for within a well-designed study rather than merely assumed away.
Two further conclusions of that work bear directly on modern regulatory practice. The study confirmed the curvilinearity of the relationship between blood lead and water lead, and concluded that even relatively low water lead concentrations — below 40 µg/L — may make a substantial contribution to blood lead [20]. Curvilinearity means that proportionally greater increases in blood lead occur at the lower end of the water lead range, so reductions achieved at already modest concentrations are not negligible.
The Edinburgh Lead Study strengthened the evidence by examining multiple environmental pathways simultaneously, measuring lead in household dust, drinking water and children’s blood rather than considering water in isolation. Apportioning the respective contributions of water and dust lead to blood lead in children aged six to nine, Raab and colleagues found both sources significantly related to blood lead, and estimated that an exposure of 100 µg/L in kitchen cold water was equivalent to 2,700 µg/g of lead in dust. In that population, water was the more important source of lead than dust for the bulk of the population [23].
A parallel analysis of 495 Edinburgh children examined lead in dust vacuumed from household floors and found a significant relationship with blood lead. Multiple regression incorporating both drinking water and household dust estimated that a 1,000 µg/g increase in dust lead concentration would raise blood lead by 1.9 µg/dL for a child at the population median of 10.1 µg/dL [24]. Dust lead therefore remained significantly associated with blood lead after adjustment for drinking-water exposure, demonstrating that multiple pathways contribute simultaneously. Rather than weakening the importance of drinking water, these findings established that blood lead reflects cumulative exposure from several sources, with drinking water becoming particularly important where lead-bearing plumbing and plumbosolvent water coexist.
The Edinburgh programme also linked epidemiology with engineering, demonstrating that homes containing lead storage tanks and extensive lead plumbing consistently exhibited higher drinking-water lead than neighbouring properties supplied from the same distribution system [25]. These findings explained much of the variation observed between households and showed that plumbing configuration, rather than water source alone, determined individual exposure.
Long-term studies undertaken in Glasgow reinforced these conclusions. Progressive introduction of pH correction followed by orthophosphate dosing substantially reduced drinking-water lead across the public supply [21, 26], and corresponding reductions in maternal blood lead demonstrated that engineering interventions designed to reduce lead release also reduced biological exposure. Elevated drinking-water lead nevertheless persisted in properties retaining extensive lead plumbing [26, 27], illustrating that corrosion control reduced rather than eliminated the underlying source of exposure.
Collectively, the UK investigations established four fundamental principles:
- drinking water can contribute significantly to blood lead concentrations;
- the magnitude of the contribution depends upon plumbing configuration and water chemistry;
- reducing lead concentrations in drinking water reduces blood lead concentrations; and
- engineering, epidemiology and public health are inseparable when investigating drinking-water lead exposure.
These conclusions have subsequently been reproduced internationally.
4.3 International observational evidence
Evidence from outside the United Kingdom has consistently supported the relationship. Although studies differ in design, environmental conditions and plumbing systems, they demonstrate the same fundamental observation: where lead-bearing plumbing contaminates drinking water, increased drinking-water lead is generally associated with increased blood lead.
A cross-sectional study undertaken in Hamburg, Germany, examined 248 non-smoking young women exposed to varying concentrations of lead in household drinking water. Participants whose tap water contained lead above the detection limit of 5 µg/L (n=142) showed significantly higher blood lead — median 31 µg/L — than the 106 participants with no detectable tap-water lead, whose median was 24 µg/L (p≤0.001). Across the 142 matched value pairs the correlation between average tap-water lead and blood lead was significant (Spearman’s rho 0.43, p≤0.0001) [28]. A further finding of note is that most participants did not know what material their home plumbing was made from — a limitation on any purely voluntary, householder-led approach to risk management.
Canadian investigations have demonstrated that homes supplied through lead service lines are substantially more likely to exhibit elevated drinking-water lead, particularly following prolonged stagnation [43, 45]. Canadian work has also produced direct biomonitoring evidence. A Montréal study of 298 children aged one to five combined venous blood sampling with five one-litre kitchen-tap samples per home and constructed a cumulative water lead exposure index. Each one-unit increase in that index multiplied expected blood lead by 1.10 (95% CI 1.06–1.15) after adjustment for confounders, with a significant dose–response trend across exposure percentiles. The authors concluded that in this age group, an increase of 1 µg/L in water lead would produce a 35% increase in blood lead after 150 days of exposure [30].
The Flint water crisis provided another important natural experiment. Following a change in water source into an ageing distribution system without adequate corrosion control, lead release from service lines increased substantially [46]. Reviewing blood lead in children under five before (2013) and after (2015) the source change, investigators found that the incidence of elevated blood lead rose from 2.4% to 4.9% (p<0.05), that neighbourhoods with the highest water lead levels experienced a 6.6% increase, and that no significant change was seen outside the city [29]. That final point is important: the surrounding area functioned as a control population, and the absence of change there makes alternative explanations considerably harder to sustain. Although Flint involved multiple regulatory and operational failures, it provided compelling modern evidence that substantial increases in drinking-water lead are reflected by measurable increases in biological exposure.
Contemporary evidence continues to accumulate. A 2025 cross-sectional study of 1,210 infants aged twelve months or younger in Milwaukee, Wisconsin, linked venous blood lead results collected between 2018 and 2021 to whether the child’s primary residence had a lead service line. Just over half of residences had one. After adjustment for age, sex, race and ethnicity, Medicaid status, neighbourhood poverty, season of testing and age of residence, the presence of a lead service line was associated with a blood lead concentration of 3.5 µg/dL or greater (OR 1.60; 95% CI 1.04–2.46; P=.03). Sensitivity analyses at alternative cut points gave consistent results, including OR 2.26 (95% CI 1.23–4.16; P=.008) at a 5.0 µg/dL threshold [31]. The study is notable for examining infants specifically, a group in whom routine lead screening does not typically begin until twelve months of age. Its authors were unable to observe whether individual infants were formula-fed or whether households used tap, bottled or filtered water, so it establishes an association with lead service lines rather than isolating the formula pathway.
Intervention work undertaken in Toamasina, Madagascar, demonstrated that replacing lead-containing components within hand-operated drinking-water pumps substantially reduced drinking-water lead and produced significant reductions in children’s blood lead. Of 55 children tested before and after the leaded pump components were removed, 87% experienced a significant decrease in blood lead [32]. The study is notable both for measuring environmental and biological endpoints in the same population and for demonstrating the relevance of aqueous lead exposure in a low- and middle-income setting where it has rarely been examined.
Large-scale studies continue to demonstrate the relevance of drinking-water exposure today. Recent work in Chicago combined household drinking-water testing with exposure modelling. Drawing on 38,385 household lead tests collected between January 2016 and September 2023 and applying machine learning and microsimulation, investigators estimated that 68% of children younger than six in Chicago are exposed to lead-contaminated drinking water, with 19% of affected children relying on unfiltered tap water as their primary drinking source — approximately 129,000 children in total [33]. The study also demonstrated marked geographical and socioeconomic inequalities in both exposure and testing, with Black and Latino residents more likely to be exposed and less likely to have their homes tested. These are modelled exposure estimates rather than measured blood lead concentrations, and should be read as such; but they establish that drinking-water lead remains a contemporary public-health issue rather than simply a historical concern.
Taken together, these investigations demonstrate that the relationship between drinking-water lead and blood lead is reproducible across different countries, water chemistries, plumbing systems and regulatory environments. Differences in effect size are largely explained by differences in plumbing configuration, corrosion control and competing environmental lead sources rather than by contradictory findings.
4.4 Intervention studies
Intervention studies provide stronger evidence than observational investigations because they examine whether reducing drinking-water lead results in measurable reductions in blood lead.
The earliest large-scale evidence originated from the United Kingdom following implementation of corrosion-control treatment. Reductions in drinking-water lead following pH correction and later orthophosphate dosing were accompanied by significant reductions in blood lead among exposed populations, demonstrating that modifying drinking-water chemistry altered biological exposure [20, 21].
The Hamburg study included an intervention arm in which 52 women who completed the programme were asked either to minimise exposure by flushing the tap before use or to exclude it by consuming bottled water. The intervention produced a significant reduction in blood lead overall, with a median decrease of 11 µg/L (p≤0.001). Those minimising exposure reduced blood lead by approximately 21% of their initial value and those excluding it by approximately 37%, but the difference between the two approaches was not statistically significant (p≤0.17) [28]. The distinction matters: the evidence supports the conclusion that reducing tap-water exposure lowers blood lead, but does not establish that bottled water outperforms flushing. A further finding limits the practical value of both: most participants judged neither approach a sustainable long-term behaviour. Behavioural mitigation reduces exposure while it is maintained, and people do not maintain it.
The strongest modern intervention evidence comes from Madagascar, where replacement of lead-containing pump components reduced aqueous lead concentrations below guideline values in almost all pumps and produced significant reductions in children’s blood lead [32]. Unlike many engineering studies, this investigation measured both environmental exposure and biological response, providing direct evidence that remediation of drinking-water infrastructure reduces internal lead exposure. Its principal limitation is scale: 55 children in a single city.
Engineering investigations undertaken in Canada and the United States have consistently demonstrated that full replacement of lead service lines substantially reduces drinking-water lead concentrations — sequential sampling in Flint found that lead service line removal reduced the lead contributed to drinking water by an average of 86% [46] — whereas partial replacement may temporarily increase particulate lead release through disturbance of corrosion scales and galvanic corrosion [42, 43, 44, 45]. Although relatively few of these studies incorporated paired blood lead measurements, they establish the engineering mechanism through which reductions in blood lead would be expected to occur. Independent evidence syntheses continue to note that paired biomonitoring data confirming blood-lead reductions following full replacement remain limited [18].
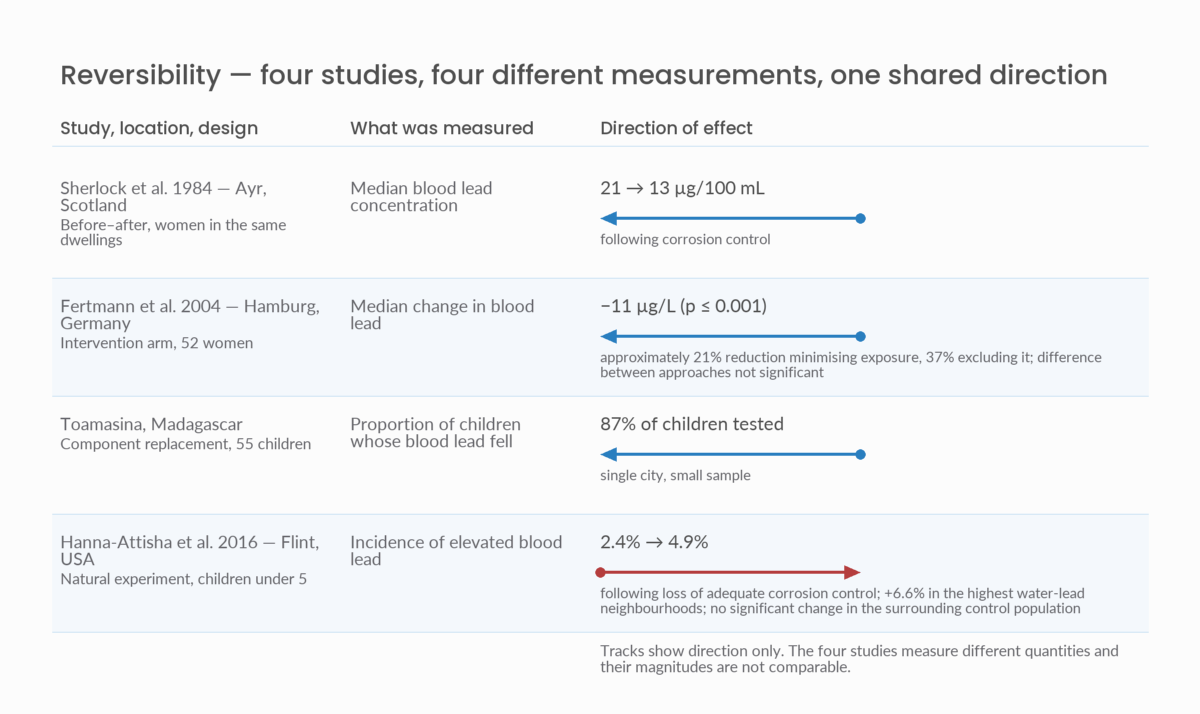
Figure 1. Four interventions in four populations, measured four different ways. Where drinking-water lead fell, blood lead fell; in the single case where drinking-water lead rose, blood lead rose. The magnitudes are governed by baseline exposure, completeness of the intervention and competing sources, and are not comparable across studies. Direction is.
4.5 Quantitative synthesis
The studies reviewed above differ so substantially in design, setting and baseline exposure that formal pooling would be inappropriate. Their value lies instead in the consistency of direction across that heterogeneity.
The interventions examined span corrosion-control treatment of a public supply, individual behavioural change, and physical removal of lead-bearing components. The populations span Scottish women, German women, Malagasy children, Canadian children and American infants. Baseline exposures differ by more than an order of magnitude. Yet in Ayr, corrosion control lowered median blood lead from 21 to 13 µg/100 mL [20]; in Hamburg, behavioural intervention produced a median reduction of 11 µg/L [28]; in Toamasina, component replacement lowered blood lead in 87% of children tested [32]. Where the exposure change ran in the opposite direction, so did the biological response: in Flint the incidence of elevated blood lead approximately doubled following loss of adequate corrosion control, with the largest increases in the neighbourhoods with the highest water lead and no significant change in the surrounding control population [29].
Effect magnitudes vary widely, and should be expected to, since they are governed by baseline exposure, the completeness of the intervention and the presence of competing sources. What does not vary is direction. Across every study reviewed in which drinking-water lead was reduced and blood lead was measured, blood lead fell; in the single case where drinking-water lead rose, blood lead rose. This reversibility, demonstrated bidirectionally and in independent populations, substantially strengthens the epidemiological evidence and supports a causal interpretation of the observed relationship.
| Study (year) | Location / design | Population | Key finding | Notes |
|---|---|---|---|---|
| Sherlock et al. (1984) [20] | Ayr, Scotland; before–after | Women, same dwellings | Median BLL fell 21 → 13 µg/100 mL after corrosion control | Curvilinear relationship; contribution at <40 µg/L water lead |
| Raab et al. (1987) [23] | Edinburgh; cross-sectional | Children 6–9 y | Water the more important source for most of population | 100 µg/L kitchen cold water ≈ 2,700 µg/g dust |
| Laxen et al. (1987) [24] | Edinburgh; cross-sectional | 495 children | Dust lead significant after adjustment for water | 1,000 µg/g dust → +1.9 µg/dL at median 10.1 µg/dL |
| Fertmann et al. (2004) [28] | Hamburg; cross-sectional + intervention | 248 women; 52 in intervention | Median BLL 31 vs 24 µg/L; intervention −11 µg/L | Flushing vs bottled water difference not significant |
| Hanna-Attisha et al. (2016) [29] | Flint, USA; natural experiment | Children <5 y | Elevated BLL incidence 2.4% → 4.9% | +6.6% in highest water-lead areas; control area unchanged |
| Ngueta et al. (2016) [30] | Montréal; cross-sectional | 298 children 1–5 y | Cumulative water-lead index ×1.10 per unit (1.06–1.15) | Significant dose–response trend |
| Buerck et al. (2023) [32] | Toamasina, Madagascar; intervention | 55 children | 87% showed significant BLL decrease after pump remediation | Paired environmental and biological endpoints |
| Huynh et al. (2024) [33] | Chicago; modelling | Children <6 y | 68% estimated exposed (~129,000) | Modelled, not measured; marked equity disparities |
| Balza et al. (2025) [31] | Milwaukee, USA; cross-sectional | 1,210 infants ≤12 mo | LSL associated with BLL ≥3.5 µg/dL, OR 1.60 (1.04–2.46) | OR 2.26 (1.23–4.16) at 5.0 µg/dL cut point; research letter |
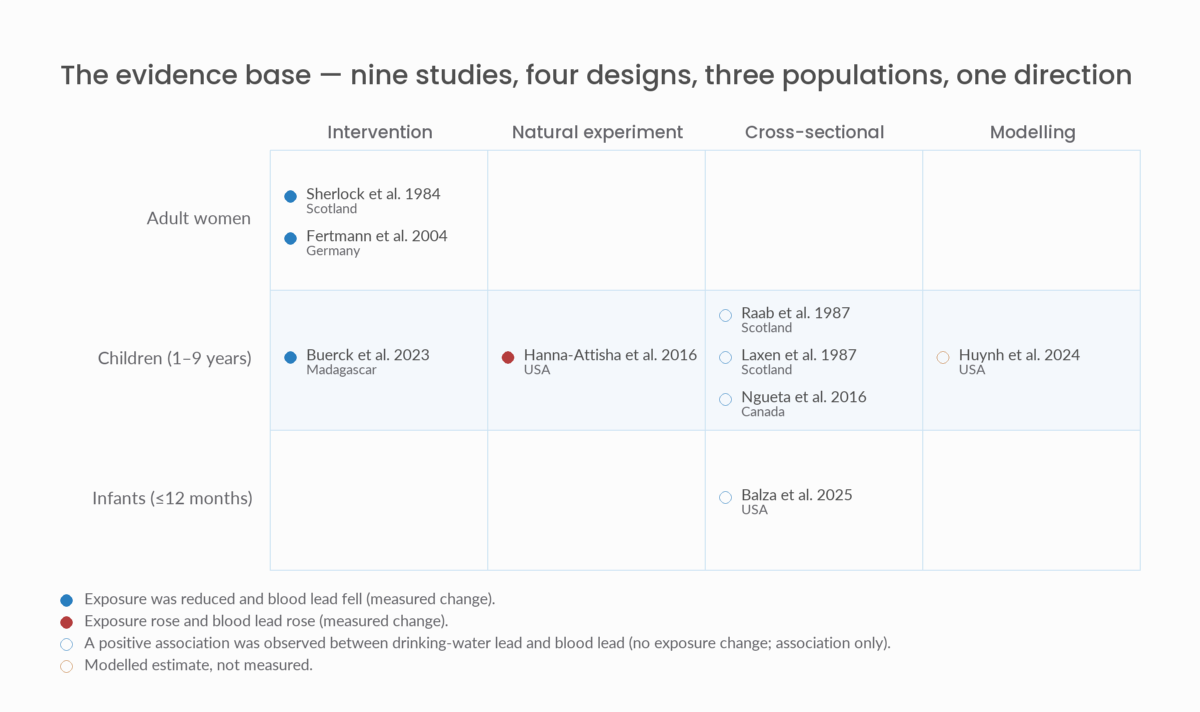
Figure 2. Nine studies across five countries, four study designs and three populations. Three tested an intervention, one observed the loss of one, four measured associations in unchanged populations and one modelled exposure. Where drinking-water lead fell, blood lead fell; where it rose, blood lead rose; where neither changed, higher water lead was associated with higher blood lead. The designs and populations are heterogeneous. The direction is not.
Factors influencing the relationship between drinking-water lead and blood lead
The epidemiological evidence demonstrates a consistent relationship between drinking-water lead and blood lead. However, the strength of that relationship varies considerably between individuals and populations. This variability reflects differences in environmental exposure rather than inconsistency within the evidence itself, and understanding its principal determinants is essential when interpreting the studies reviewed above.
The most important determinant is the presence and extent of lead-bearing plumbing. Properties supplied through long lead service lines generally experience greater lead release than those containing only short sections of lead pipework [45]. Internal lead plumbing, lead storage tanks and extensive lead-containing fittings further increase the potential for exposure by increasing the surface area of lead in contact with drinking water. Studies from the United Kingdom consistently demonstrated that plumbing configuration explained much of the variation in drinking-water lead observed between neighbouring properties supplied by the same water main [25].
Water chemistry is equally important. Lead release is governed by corrosion processes that depend upon pH, alkalinity, dissolved inorganic carbon and phosphate concentration [34, 37, 38]. Soft, acidic waters promote greater dissolution because stable protective scales develop less readily [22]; harder waters generally support more protective mineral deposits [36]. Identical plumbing systems may therefore produce markedly different drinking-water lead concentrations depending upon the chemistry of the supplied water.
Water use also influences exposure. Water remaining stagnant within lead plumbing accumulates higher lead concentrations because of increased contact time, and overnight stagnation frequently produces the highest concentrations measured within domestic supplies [45, 46]. Flushing the tap before use generally reduces dissolved lead [28], although it may not eliminate particulate lead released through disturbance of corrosion scales [44].
Individual behaviour further modifies exposure. Total water consumption, preparation of infant formula, use of bottled or filtered water, occupancy patterns and flushing practices all influence the quantity of lead ultimately ingested [19, 28]. Infants represent a particularly important group because formula prepared using contaminated tap water may constitute a substantial proportion of total daily dietary intake during a period of increased gastrointestinal absorption [15, 19].
Alternative environmental lead sources also influence interpretation. Household dust, deteriorating lead-based paint, contaminated soil, food and occupational exposure all contribute to blood lead [9, 15, 24], and their relative importance varies between populations according to housing age, historical land use and environmental conditions. Drinking water therefore rarely explains all variation in blood lead within a population. It should instead be regarded as one component of cumulative environmental exposure, becoming particularly important where lead-bearing plumbing remains capable of contaminating drinking water — a point demonstrated directly by the Edinburgh apportionment analysis, in which water was the more important of the two sources for most of the population studied [23].
Methodological differences between studies provide an additional explanation for variation in reported findings. Investigations differ in sampling strategy, analytical methods, timing of blood collection, participant selection and adjustment for confounding. Drinking-water samples may be collected as first-draw, flushed, random daytime or sequential samples, each representing different aspects of household exposure [17, 46].
Taken together, these factors explain why the relationship varies between studies without rendering the evidence contradictory. Drinking-water exposure is inherently context-dependent, determined by the interaction of plumbing materials, water chemistry, corrosion processes, human behaviour and competing sources.
Assessing the strength of the evidence
The relationship between drinking-water lead and blood lead has now been investigated for more than five decades using observational epidemiology, intervention studies, engineering investigations and natural experiments. While no individual study can determine the precise contribution of drinking water under every environmental condition, the accumulated evidence provides a coherent and scientifically robust explanation linking contaminated drinking water with increased biological exposure.
One of the strongest features of the evidence is its consistency. Positive associations have been reported repeatedly in the United Kingdom [19, 20, 23, 26], Germany [28], Canada [30], the United States [29, 31, 33] and elsewhere [32], despite major differences in water chemistry, plumbing systems, housing stock and regulatory frameworks. Although effect sizes vary between populations, the direction of the relationship remains remarkably consistent wherever lead-bearing plumbing contributes to contamination.
The temporal sequence of events also supports a causal interpretation. Multiple intervention studies demonstrate that reducing lead concentrations in drinking water is followed by measurable reductions in blood lead, observed following corrosion-control treatment [20], behavioural interventions [28] and remediation of contaminated infrastructure [32]. The Flint experience demonstrates the same relationship operating in the opposite direction, with blood lead rising after corrosion control was lost and remaining unchanged in the surrounding control population [29]. Blood lead therefore responds predictably to changes in drinking-water exposure rather than simply reflecting unrelated environmental factors.
Biological plausibility is equally strong. The toxicokinetics of lead are well understood, and the pathway linking drinking-water lead to blood lead is direct [15]. Lead released from plumbing is ingested, absorbed through the gastrointestinal tract and transported in the bloodstream before distribution to target organs and long-term storage within bone. This mechanism explains why reductions in drinking-water lead should produce corresponding reductions in blood lead, and provides an independent biological foundation for the epidemiological observations.
A dose–response relationship has also been demonstrated, across independent designs. Sherlock and colleagues established that the relationship is curvilinear rather than linear, with proportionally greater effects at lower water lead concentrations [20]. The Montréal cohort found a significant dose–response trend across cumulative exposure percentiles [30]. In Flint, the neighbourhoods with the highest water lead recorded the largest increases in elevated blood lead [29]. The Milwaukee infant study provides a within-study gradient: the odds ratio associated with a lead service line rose from 1.60 at a 3.5 µg/dL threshold to 2.26 at a 5.0 µg/dL threshold, indicating a stronger association with the more elevated outcome [31]. Dose–response is among the more demanding of the conventional criteria for causal inference, and the drinking-water lead literature satisfies it in four independent populations using four different analytical approaches.
Engineering evidence further strengthens the case. Corrosion studies explain how lead enters drinking water, identify the materials responsible and demonstrate the influence of water chemistry on lead release [34, 35, 37]. Studies of corrosion control and lead service line replacement consistently show substantial reductions in drinking-water lead following engineering intervention [39, 40, 41, 42]. Although these investigations frequently measure water lead rather than blood lead directly, they establish the environmental mechanism responsible for the biological associations observed epidemiologically.
Natural experiments provide particularly persuasive evidence because they examine changes occurring under real-world conditions. The introduction of corrosion-control treatment in the United Kingdom [20, 21], the loss of adequate corrosion control in Flint [29, 46] and remediation studies in Madagascar [32] all demonstrated that modifying drinking-water exposure produced changes in blood lead in the predicted direction.
The principal limitation of the literature lies not in inconsistency but in the complexity of environmental lead exposure. Blood lead reflects cumulative exposure from multiple pathways, making it impossible for drinking water to explain all variation in measured concentrations. This should not be regarded as a weakness of the evidence; it reflects the reality that environmental lead exposure is multifactorial. Modern studies increasingly account for alternative sources through statistical adjustment and study design.
Certain individual studies also carry specific limitations that should be acknowledged. The Madagascar intervention involved 55 children in a single city [32]. The Hamburg intervention arm involved 52 participants [28]. The Chicago analysis models exposure rather than measuring blood lead, and its underlying test results derive from households that opted into free testing, with implications for representativeness [33]. The Milwaukee infant study is cross-sectional, confined to one city, and lacked data on formula feeding, water type consumed and length of residence, so it cannot isolate the mechanism by which lead service lines raised blood lead; its confidence interval also approaches unity at the primary threshold [31]. Finally, while engineering studies robustly document reductions in water lead after full lead service line replacement, paired blood-lead outcome data remain relatively sparse [18].
None of these limitations is fatal, and none is unusual in environmental epidemiology. The strength of the overall case rests on the convergence of independent studies rather than on the weight of any single one.
International scientific consensus
The interpretation of the relationship between lead in drinking water and blood lead has become increasingly consistent across international public-health organisations. Although regulatory frameworks differ between countries, there is now broad scientific agreement that drinking water represents a significant and preventable source of lead exposure wherever lead-bearing plumbing remains present. This consensus reflects the cumulative weight of epidemiological, interventional, engineering and toxicological evidence rather than reliance upon any single line — and because these organisations each evaluate that evidence independently before issuing guidance, their agreement constitutes an additional line of support rather than a restatement of the same one.
The strongest area of agreement concerns the biological significance of low-level exposure. The World Health Organization [1, 3], UK Health Security Agency [4, 5], European Food Safety Authority [9], US Centers for Disease Control and Prevention [13] and other agencies now recognise that no blood lead concentration has been identified at which adverse health effects can be confidently excluded, particularly among children and the developing fetus.
International organisations also agree that drinking water should be considered one of several environmental exposure pathways rather than the dominant source in every circumstance [15, 16]. Where lead communication pipes, lead service lines, customer-side supply pipes, internal plumbing or lead-containing fittings remain present, drinking water is recognised as a potentially important contributor. Where these materials have been removed, other sources such as dust, paint or soil may become relatively more important. This interpretation closely reflects the conclusions emerging from the literature reviewed above.
A further area of consensus concerns corrosion control. Water chemistry management through pH adjustment and orthophosphate dosing is recognised as an effective means of reducing lead release while legacy infrastructure remains in service [7, 17, 39, 41]. However, major organisations increasingly distinguish between reducing lead release and removing the source of contamination. Corrosion control suppresses lead mobilisation but does not eliminate lead-bearing plumbing [7, 26]. It is therefore regarded as an important exposure-reduction measure during transition rather than a permanent substitute for infrastructure replacement.
This distinction is now visible in regulation. The recast European Drinking Water Directive [8] and UK long-term strategy work [7] both reflect a progression toward source removal. In the United States, the Lead and Copper Rule Improvements, finalised in October 2024, require replacement of lead service lines at almost all systems and lower the lead action level from 15 to 10 µg/L [11, 12]. The rule is under judicial review. The American Water Works Association petitioned for review in December 2024, challenging the ten-year replacement deadline and the requirement that utilities replace privately owned portions of a service line where they have access (American Water Works Association v. EPA, No. 24-1376, DC Circuit). The Environmental Protection Agency has defended the rule, and the Natural Resources Defense Council, Newburgh Clean Water Project and Sierra Club were admitted as intervenors in its support; amicus briefs were filed by the American Academy of Pediatrics and by seventeen state attorneys general. Briefing concluded in April 2026 and oral argument is expected in autumn 2026. The rule remains in effect during the review. Status as at July 2026.
The apparent differences between international guidance largely concern regulatory implementation rather than scientific interpretation. Drinking-water standards represent practical regulatory values balancing health protection, analytical capability and engineering feasibility, and should not be interpreted as biological safety thresholds. Organisations operating under different standards nevertheless reach remarkably similar conclusions regarding the absence of a known safe blood lead concentration and the importance of reducing avoidable exposure wherever practicable.
Public health implications
The evidence reviewed above demonstrates that drinking water should be regarded as an important environmental exposure pathway wherever lead-bearing plumbing remains present. Although the magnitude of its contribution varies between populations, reducing lead concentrations in drinking water consistently reduces biological exposure.
Modern public-health practice has progressively shifted from responding to overt lead poisoning towards preventing chronic low-level exposure. Contemporary evidence demonstrates that adverse effects occur at substantially lower blood lead concentrations than previously recognised, particularly among children [5, 13, 15]. The emphasis has therefore moved from identifying poisoning to reducing avoidable environmental exposure before clinically significant concentrations develop.
The evidence also highlights the importance of integrated environmental investigation. Elevated blood lead should not automatically be attributed to drinking water, nor should drinking water be excluded because other sources exist. Blood lead reflects cumulative exposure from multiple pathways [24], and effective investigation therefore requires assessment of housing characteristics, plumbing materials, drinking water, household dust, soil and occupational history [4]. Where lead-bearing plumbing remains present, drinking water should always be considered a plausible and potentially important source.
Surveillance timing deserves particular attention for infants. Routine blood lead screening does not typically begin until twelve months of age, yet lead has a relatively short residence time in blood, so a water-borne exposure occurring during the first year may have substantially diminished by the time a child is first tested [31]. Where a household is known to have a lead service line, the presence of an infant is therefore an argument for acting on the plumbing rather than waiting for a blood result that may not capture the exposure.
A further implication concerns the limits of what householders can reasonably be asked to do. Behavioural mitigation reduces exposure, but the Hamburg intervention found that most participants regarded neither flushing nor bottled water as a sustainable long-term practice, and the same study found that most did not know what their plumbing was made from in the first place [28]. Approaches depending on continuous individual vigilance are therefore weaker than they appear on paper. Point-of-use filtration and flushing act at the point of intake rather than on the source: they have a legitimate role as interim measures, but they manage a hazard rather than remove it.
Socioeconomic and geographical disparities in exposure and testing compound this problem. The Chicago analysis found that Black and Latino residents were both more likely to be exposed and less likely to have their homes tested [33], a pattern consistent with the concentration of legacy infrastructure in older, lower-income neighbourhoods. Where the households most exposed are also the least likely to be tested, voluntary and information-led approaches will systematically under-reach the population that most needs them, which strengthens the case for proactive, system-level identification and replacement.
The review further demonstrates the close relationship between engineering and public health. Engineering investigations explain how lead enters drinking water and identify the conditions promoting its release. Epidemiological studies demonstrate that increased drinking-water lead results in increased blood lead. Intervention studies confirm that reducing drinking-water lead lowers blood lead. Together, these complementary disciplines provide a coherent understanding of how infrastructure influences human health.
There are also economic dimensions. Analyses of lead hazard control have consistently concluded that the costs of reducing childhood lead exposure are substantially outweighed by the avoided social and economic costs [47, 48, 49]. This is relevant to infrastructure decisions because lead service line replacement carries high visible capital costs against benefits that are diffuse, delayed and borne by different parties.
These considerations converge on a single point. The quality of water leaving treatment works represents only one determinant of consumer exposure; the condition of the distribution network and domestic plumbing may matter as much or more [6, 7]. What distinguishes drinking water from most other environmental lead pathways is that its contribution can be measured at the point of exposure, attributed to identifiable physical components, and eliminated by replacing them. Household dust, contaminated soil and deteriorating paint permit no equivalent intervention — they can be managed, but not removed by a single decisive act. This is why drinking water retains its importance in public-health practice even as the prevalence of lead plumbing declines: the remaining exposure is concentrated in a shrinking, identifiable population of properties, and it is precisely the kind of exposure that can be brought permanently to an end.
Conclusions
This review has examined more than five decades of epidemiological, engineering and public-health evidence investigating the relationship between lead concentrations in drinking water and blood lead concentrations. Considered collectively, the available evidence demonstrates a consistent and biologically plausible association wherever lead-bearing plumbing remains in service.
Observational studies undertaken across multiple countries consistently show that elevated drinking-water lead is associated with increased blood lead. Intervention studies further demonstrate that reducing lead concentrations in drinking water produces measurable reductions in blood lead, strengthening the evidence beyond simple observational association. Engineering investigations explain the mechanisms responsible for lead release and provide the environmental context within which these relationships occur.
The United Kingdom has made a particularly important contribution to this evidence base. The combination of naturally plumbosolvent water supplies, extensive lead plumbing, detailed epidemiological investigations and long-term corrosion-control programmes created one of the world’s most comprehensive natural experiments in reducing drinking-water lead exposure. International studies have consistently confirmed the principal conclusions first established through this work, most recently in US infant data linking lead service lines to elevated blood lead [31].
Although drinking water is not the dominant source of lead exposure in every population, the evidence demonstrates that it can make a substantial contribution wherever lead-bearing plumbing exists — and in at least one well-characterised UK population it was the more important of the two principal sources for most residents [23]. The magnitude of this contribution depends upon plumbing configuration, water chemistry, corrosion processes, human behaviour and competing sources. These factors explain much of the variation observed between studies without challenging the existence of the underlying relationship.
The overall body of evidence is coherent across disciplines. Epidemiology identifies the association, intervention studies demonstrate reversibility in both directions, engineering explains the mechanism, toxicology explains the biological response, and international public-health organisations have reached broadly consistent conclusions.
Future research should focus on improving quantification of source-specific exposure, expanding paired engineering and biomonitoring studies following full infrastructure remediation, and refining methods for identifying populations at greatest risk. Nevertheless, the central scientific question addressed by this review can now be answered with considerable confidence. Where lead-bearing plumbing remains present, lead in drinking water contributes measurably to blood lead concentrations, and reducing that exposure reduces the biological burden of lead. That conclusion represents one of the clearest examples of the relationship between drinking-water infrastructure and public health.
Note
1 For context, US EPA estimates that where lead plumbing is present, drinking water may contribute 20% or more of a person’s total lead exposure, rising to 40–60% for infants whose formula is prepared with tap water [10]. This is a regulatory communications estimate rather than a finding derived from a specific primary study: no underlying derivation is published alongside it, it is rendered inconsistently across EPA-derived materials, and it describes US conditions. It indicates possible scale, not evidence of the relationship itself. ↩
Disclosure
This article is published by London & Surrey Water Services Ltd, a CIPHE member and WaterSafe registered contractor whose business includes lead pipe replacement. The company therefore has a commercial interest in the subject matter. The article is restricted to findings and positions reported in the sources cited, and no claim is made here that is not traceable to those sources. It is not medical advice. Readers concerned about lead exposure should speak to their GP, and readers concerned about lead in their own water supply should contact their water supplier or seek independent laboratory testing.
References
- World Health Organization. WHO Guideline for Clinical Management of Exposure to Lead. Geneva: World Health Organization; 2021. ISBN 978-92-4-003704-5.
- World Health Organization. Lead Poisoning and Health. Fact sheet. Geneva: World Health Organization. [accessed 27 July 2026]
- World Health Organization. Chemical Fact Sheets: Lead. Geneva: World Health Organization; 2022.
- UK Health Security Agency. Lead: Environmental and Public Health Intervention. London: UKHSA; updated 2025.
- UK Health Security Agency. Lead: Toxicological Overview. London: UKHSA; updated October 2024.
- Drinking Water Inspectorate. Lead in Drinking Water. London: Drinking Water Inspectorate. [accessed 27 July 2026]
- Hulance J, Kowalski M, Fairhurst R. Long-term Strategies to Reduce Lead Exposure from Drinking Water. Report Reference DWI14372.2. Swindon: WRc for the Drinking Water Inspectorate; 2021.
- European Parliament and Council. Directive (EU) 2020/2184 on the Quality of Water Intended for Human Consumption (Recast Drinking Water Directive). Official Journal of the European Union. 2020.
- EFSA Panel on Contaminants in the Food Chain (CONTAM). Scientific opinion on lead in food. EFSA Journal. 2010;8(4):1570. doi:10.2903/j.efsa.2010.1570
- United States Environmental Protection Agency. Basic Information About Lead in Drinking Water. Washington DC: US EPA. [accessed 27 July 2026]
- United States Environmental Protection Agency. National Primary Drinking Water Regulations for Lead and Copper: Improvements (LCRI). Final rule. Federal Register, 30 October 2024.
- United States Environmental Protection Agency. Lead and Copper Rule Improvements. Washington DC: US EPA. [accessed 27 July 2026]
- Centers for Disease Control and Prevention. Blood Lead Reference Value. Atlanta: CDC; 2024.
- Centers for Disease Control and Prevention. About Lead in Drinking Water. Atlanta: CDC; 2025.
- Agency for Toxic Substances and Disease Registry. Toxicological Profile for Lead. Atlanta: ATSDR; 2020.
- Health Canada. Guidelines for Canadian Drinking Water Quality: Guideline Technical Document – Lead. Ottawa: Health Canada; 2019.
- Health Canada. Guidance on Sampling and Mitigation Measures for Controlling Lead Corrosion in Drinking Water Distribution Systems. Ottawa: Health Canada; 2025.
- County Health Rankings & Roadmaps. Lead Pipe and Plumbing Material Replacement Interventions. What Works for Health. Madison: University of Wisconsin Population Health Institute; updated September 2024.
- Sherlock JC, Smart G, Forbes GI, Moore MR, Patterson WJ, Richards WN, Wilson TS. Assessment of lead intakes and dose–response for a population in Ayr exposed to a plumbosolvent water supply. Human Toxicology. 1982;1(2):115–122. doi:10.1177/096032718200100203
- Sherlock JC, Ashby D, Delves HT, Forbes GI, Moore MR, Patterson WJ, Pocock SJ, Quinn MJ, Richards WN, Wilson TS. Reduction in exposure to lead from drinking water and its effect on blood lead concentrations. Human Toxicology. 1984;3(5):383–392. doi:10.1177/096032718400300503
- Richards WN, Moore MR. Lead hazard controlled in Scottish water systems. Journal AWWA. 1984;76(8):60–67.
- Moore MR. Influence of acid rain upon water plumbosolvency. Environmental Health Perspectives. 1985;63:121–126. doi:10.1289/ehp.8563121
- Raab GM, Laxen DPH, Fulton M. Lead from dust and water as exposure sources for children. Environmental Geochemistry and Health. 1987;9(3–4):80–85. doi:10.1007/BF02057280
- Laxen DPH, Raab GM, Fulton M. Children’s blood lead and exposure to lead in household dust and water — a basis for an environmental standard for lead in dust. Science of the Total Environment. 1987;66:235–244. doi:10.1016/0048-9697(87)90091-X
- Raab GM, Laxen DPH, Anderson N, Davis S, Heaps M, Fulton M. The influence of pH and household plumbing on water lead concentration. Environmental Geochemistry and Health. 1993;15(4):191–200. doi:10.1007/BF00146742
- Watt GCM, Britton A, Gilmour WH, Moore MR, Murray GD, Robertson SJ, Womersley J. Is lead in tap water still a public health problem? An observational study in Glasgow. BMJ. 1996;313(7063):979–981. doi:10.1136/bmj.313.7063.979
- Watt GCM, Britton A, Gilmour WH, Moore MR, Murray GD, Robertson SJ. Public health implications of new guidelines for lead in drinking water: a case study in an area with historically high water lead levels. Food and Chemical Toxicology. 2000;38:S73–S79. doi:10.1016/S0278-6915(99)00137-4
- Fertmann R, Hentschel S, Dengler D, Janßen U, Lommel A. Lead exposure by drinking water: an epidemiological study in Hamburg, Germany. International Journal of Hygiene and Environmental Health. 2004;207(3):235–244. doi:10.1078/1438-4639-00285
- Hanna-Attisha M, LaChance J, Sadler RC, Champney Schnepp A. Elevated blood lead levels in children associated with the Flint drinking water crisis: a spatial analysis of risk and public health response. American Journal of Public Health. 2016;106(2):283–290. doi:10.2105/AJPH.2015.303003
- Ngueta G, Abdous B, Tardif R, St-Laurent J, Levallois P. Use of a cumulative exposure index to estimate the impact of tap water lead concentration on blood lead levels in 1- to 5-year-old children (Montréal, Canada). Environmental Health Perspectives. 2016;124(3):388–395. doi:10.1289/ehp.1409144
- Balza J, Dawson AZ, Nelson D, Kaeppler C, Cusatis R, Flynn KE. Lead service lines and infant blood lead levels. JAMA Network Open. 2025;8(12):e2550444. doi:10.1001/jamanetworkopen.2025.50444
- Buerck AM, Khaliq M, Alfredo K, Cunningham JA, Barrett LJP, Rakotondrazaka R, Rakotoarisoa L, Champion WM, Mihelcic JR. Reductions in children’s blood lead levels from a drinking-water intervention in Madagascar, sub-Saharan Africa. Environmental Science & Technology. 2023;57(43):16309–16316. doi:10.1021/acs.est.3c03774
- Huynh BQ, Chin ET, Kiang MV. Estimated childhood lead exposure from drinking water in Chicago. JAMA Pediatrics. 2024;178(5):473–479. doi:10.1001/jamapediatrics.2024.0133
- Schock MR. Response of lead solubility to dissolved carbonate in drinking water. Journal AWWA. 1980;72(12):695–704. doi:10.1002/j.1551-8833.1980.tb04616.x [Erratum: Journal AWWA. 1981;73(3):36]
- Sheiham I, Jackson PJ. The scientific basis for control of lead in drinking water by water treatment. Journal of the Institution of Water Engineers and Scientists. 1981;35(6):491.
- Colling JH, Croll BT, Whincup PAE, Harward C. Plumbosolvency effects and control in hard waters. Water and Environment Journal. 1992;6:259–268. doi:10.1111/j.1747-6593.1992.tb00750.x
- Schock MR, Wagner I, Oliphant RJ. The corrosion and solubility of lead in drinking water. In: Internal Corrosion of Water Distribution Systems. 2nd ed. Denver: AWWA Research Foundation; 1996.
- Schock MR, Clement JA. Control of lead and copper with non-zinc orthophosphate. Journal of the New England Water Works Association. 1998;112(1):20.
- Hayes CR, Incledion S, Balch M. Experience in Wales (UK) of the optimisation of ortho-phosphate dosing for controlling lead in drinking water. Journal of Water and Health. 2008;6(2):177–185. doi:10.2166/wh.2008.044
- Cardew PT. Measuring the benefit of orthophosphate treatment on lead in drinking water. Journal of Water and Health. 2009;7(1):123–131. doi:10.2166/wh.2009.015
- Hayes CR, Hydes OD. UK experience in the monitoring and control of lead in drinking water. Journal of Water and Health. 2012;10(3):337–348. doi:10.2166/wh.2012.210
- Trueman BF, Camara E, Gagnon GA. Evaluating the effects of full and partial lead service line replacement on lead levels in drinking water. Environmental Science & Technology. 2016;50(14):7389–7396. doi:10.1021/acs.est.6b01912
- Deshommes E, Laroche L, Deveau D, Nour S, Prévost M. Short- and long-term lead release after partial lead service line replacements in a metropolitan water distribution system. Environmental Science & Technology. 2017;51(17):9507–9515. doi:10.1021/acs.est.7b01720
- Doré E, Deshommes E, Laroche L, Nour S, Prévost M. Study of the long-term impacts of treatments on lead release from full and partially replaced harvested lead service lines. Water Research. 2019;149:566–577.
- Deshommes E, Trueman B, Douglas I, Huggins D, Laroche L, Swertfeger J, Spielmacher A, Gagnon GA, Prévost M. Lead levels at the tap and consumer exposure from legacy and recent lead service line replacements in six utilities. Environmental Science & Technology. 2018;52(16):9451–9459. doi:10.1021/acs.est.8b02388
- Lytle DA, Schock MR, Wait K, Cahalan K, Bosscher V, Porter A, Del Toral M. Sequential drinking water sampling as a tool for evaluating lead in Flint, Michigan. Water Research. 2019;157:40–54. doi:10.1016/j.watres.2019.03.042
- Gould E. Childhood lead poisoning: conservative estimates of the social and economic benefits of lead hazard control. Environmental Health Perspectives. 2009;117(7):1162–1167. doi:10.1289/ehp.0800408
- Muennig P. The social costs of childhood lead exposure in the post-lead regulation era. Archives of Pediatrics & Adolescent Medicine. 2009;163(9):844–849. doi:10.1001/archpediatrics.2009.128
- Attina TM, Trasande L. Economic costs of childhood lead exposure in low- and middle-income countries. Environmental Health Perspectives. 2013;121(9):1097–1102. doi:10.1289/ehp.1206424