
Internal lead pipework is rarely replaced all at once. It goes in stages — a run moved, a section taken out, new copper joined to what is already there — with the joint made in brass, and the service pipe outside usually last of all. That work accumulates over decades, most of it done while the property is still fed through lead.
Every one of those joints is a galvanic cell. Lead and copper have different electrode potentials, so where they meet in water the lead corrodes preferentially, at and near the joint. It comes off as particles rather than in solution, and it can continue for months.
That distinction carries the rest of this article. Dissolved lead accumulates with standing time and flushes away. Particulate lead does neither. It is what British government research measured in the 1980s, what the international literature on partial lead service line replacement has measured since, and what a brass fitting on a lead pipe reliably produces.
The Water Supply (Water Fittings) Regulations 1999 do not treat this as a matter of good practice. Schedule 2 requires every water fitting to be immune to or protected from corrosion by galvanic action, and the prohibition on using materials likely to cause contamination applies expressly to the construction, installation, renewal, repair or replacement of a water fitting. Repair is named in the legislation.[15]
Table of Contents
What galvanic corrosion actually is
Corrosion of a metal in water is an electrochemical reaction. Metal atoms at the surface give up electrons and pass into solution as ions; the electrons are consumed by a second reaction elsewhere on the surface, typically the reduction of dissolved oxygen. Both halves happen on the same piece of metal, more or less evenly, and the result is the slow general corrosion any metal pipe undergoes.
Connect that metal to a different metal and the two halves separate.
The cell. A galvanic cell requires four things present at once: two metals of different electrode potential; electrical continuity between them, so electrons can flow; an electrolyte — water carrying dissolved ions — in contact with both; and a completed circuit. Remove any one and there is no cell. That is the basis of the remedy discussed later in this article: remove the electrical continuity and the remaining three conditions become harmless.
Where the conditions are met, the metal of lower electrode potential becomes the anode. It supplies the electrons, and all the oxidation concentrates there. The other becomes the cathode, where electrons are consumed, and it is protected. This is the principle behind sacrificial anodes in hot water cylinders and on ship hulls: a deliberately fitted mass of a more reactive metal corrodes so that the protected metal does not.
In a lead pipe joined to copper, the pipe is the anode.
Where lead sits. Lead sits below copper in the ranking of how readily metals give up electrons. Joined to copper, lead corrodes preferentially. The same is true of the copper alloys — brass is copper, zinc and lead; bronze is copper and tin — and the World Health Organization’s technical brief notes that bronze has galvanic corroding properties similar to brass with regard to lead [18]. Galvanised iron and stainless steel also form couples with lead[10], which is why the WHO specification names copper, brass, bronze and galvanised iron together. In the configurations relevant here, lead joined to a common plumbing metal is never the protected member.
Why the joint rather than the pipe. Galvanic corrosion is not distributed evenly along the anode. Current flows through the water between the two metals, and the resistance of that path rises with distance. The shortest path, and therefore the highest current density, is immediately at the junction. Corrosion concentrates there and diminishes along the pipe away from it.
This is why the argument of this article concerns joints rather than lengths. A partial replacement is not problematic because there is less lead than before; it is problematic because a junction has been created and the corrosion concentrates at it.
Relative area. The rate of anodic corrosion depends not only on the metals but on their relative wetted areas. The cathode collects electrons over its whole surface and everything it collects must be supplied by the anode, so a large cathode connected to a small anode drives intense local metal loss. In an alteration the exposed cathode is the fitting and the copper joined to it — but the anodic attack is also concentrated at the junction. Both effects act in the same direction.
What the water contributes. The electrolyte is not a passive medium. Its composition determines how much current flows for a given pair of metals, which is why identical fittings behave completely differently in different supplies.
Conductivity: more dissolved ions means lower resistance between anode and cathode, and more current.
Chloride raises conductivity and is aggressive towards protective surface films. The British study of thirty-eight supplies found chloride concentration among the three variables most strongly associated with galvanic corrosion potential[7].
Sulphate acts in the opposite direction. The relationship between the two is expressed as the chloride-to-sulphate mass ratio, and it is this ratio rather than either ion alone that emerged as the strongest single predictor in both the 1985 UK work and the later international literature.
Nitrate: Gregory (1985) found high nitrate associated not only with higher corrosion but with unstable corrosion, cell voltages swinging widely from day to day rather than settling. Variability was negligible in most waters below 1 mg/l nitrate-nitrogen and most substantial in those with the highest concentrations.[7]
pH: no significant effect. This is counter-intuitive, because pH governs the solubility of lead in ordinary plumbosolvent attack and pH adjustment is a standard corrosion control measure. It does not govern the galvanic couple.
What comes off the pipe. The distinction between the two forms of lead reaching the tap was set out plainly in the final report of the Department of the Environment galvanic corrosion programme [21], and it remains the clearest statement of it.
With lead pipe, the report notes, the concentration of lead in water is governed by the solubility of the products of simple oxidative corrosion, and the concentrations that occur do so reproducibly and predictably.
Where lead is coupled to copper, that changes. Corrosion becomes predominantly galvanic and proceeds at a much greater rate than simple oxidative corrosion. And the consequence is not merely more of the same:
“The resulting corrosion product is morphologically different. Consequently, it is easily released to the water as ‘particulate lead’ to result in lead concentrations greater than solubility and which can occur apparently randomly.”
Three things follow from that sentence, and they run through the rest of this article.
Concentrations exceed solubility. Dissolved lead is bounded by what the water can hold. Particulate lead is not, because it is solid material in suspension rather than metal in solution.
Release is apparently random. It does not accumulate predictably with standing time in the way dissolved lead does. It moves when the flow changes, which makes consecutive samples from the same tap inconsistent.
The product is physically different. The earlier WRc work for the Department of the Environment [21] examined the tendency of thick corrosion product layers to break off the metal surface, producing a particulate contamination problem. This is corrosion scale detaching, not lead dissolving.
The international research reached the same conclusion by a different route. Wang et al. (2012) found that where galvanic corrosion was occurring, the increase in release was primarily particulate, and identified galvanic corrosion as the primary cause of the particulate release in brass-coupled systems.[13]
What normally protects a lead pipe. An old lead pipe is not bare lead. Decades of contact with treated water build a layer of corrosion products on the inside wall, and that layer is the main barrier between the metal and the water. Water companies manage it deliberately: orthophosphate dosing encourages a poorly soluble lead phosphate layer, which is why most lead supply pipes in England and Wales deliver water below the legal threshold despite being lead.
Two things interfere with it. Mechanical disturbance breaks the layer, releasing scale as particulates — transient, and it flushes. A galvanic couple attacks the metal beneath it, produces a corrosion product of different morphology, and does not resolve as the layer re-forms, because the driver remains connected.
An alteration does both at once.
The 1985 evidence, and why it shaped the rules
In December 1983 the Water Research Centre began work for the Department of the Environment measuring precisely this. The study [7], published by the Drinking Water Inspectorate as DWI0097, placed corrosion cells in the supply at thirty-eight different sources across Britain, recording the voltage across each cell over four weeks.
How it was measured. Each cell held a copper cathode and an anode of copper foil coated in tin-lead solder, connected externally through a 10 kilohm resistor, with water flowing through continuously at a standardised 25°C. Voltage across a known resistance gives current — in that design, 10 mV corresponded to 1 microamp — and current gives rate of metal loss, since every electron leaving the anode corresponds to metal passing into solution. The millivolt readings are therefore a direct proxy for how fast the lead was being consumed.
The range was extraordinary. Fourth-week averages ran from 2.24 to 194 millivolts, a spread of more than eighty-five to one, around an average of roughly 20 mV. Identical fittings, identical solder, identical copper. The only variable was the water, and it produced an eighty-five-fold range in corrosion rate.
What predicted the difference was not pH. Multiple regression found no significant effect from pH at all. The dominant variables were the chloride-to-sulphate concentration ratio, chloride concentration and nitrate, with the best-fitting equation accounting for 64% of the variance using those three alone.
Two things about that deserve attention.
The first is that the chloride-to-sulphate mass ratio is now the standard variable in the international literature on lead release from galvanic couples, and has been since the mid-2000s. It was identified as the dominant driver in British government research two decades earlier, and then largely forgotten.
The second is what the researchers concluded. Elevated lead had already been found in tap water from relatively short runs of new copper plumbing during its first three months of use, in supplies where cells read between 30 and 60 mV. Against an average of around 20 mV across all thirty-eight waters, their inference was that perhaps more than a quarter of all British supplies might produce unacceptable lead concentrations from new lead-soldered copper plumbing.
Nor did the work stop there. Phase II [19] tested silicate, sulphate, zinc and orthophosphate as inhibitors, concluding that zinc — particularly combined with orthophosphate — was the most effective. Phase III examined how to dose zinc [20]. A final report followed in 1986 [21]. Four government-funded reports on the galvanic corrosion of lead in copper pipework, all published, all still freely available.
This work was explicitly framed as relevant to the application of the New Model Water Byelaws, the framework that preceded the 1999 Regulations. The requirement now sitting in Schedule 2 is not an abstraction. It is the regulatory residue of a research programme that measured the problem, found it widespread, and went looking for a cure.
What happens when you cut into a lead pipe
In 2016 WRc reported to Defra and the Drinking Water Inspectorate on what happens to lead concentrations when a water meter is installed into an existing lead supply pipe [2], published as DWI 70/2/282. Its subject was not galvanic corrosion but mechanical disturbance.
On a purpose-built rig using new lead pipe fed with both soft and hard phosphate-dosed water, total lead after installation rose to many times the 10 µg/l legal threshold: up to 278 µg/l in first-flush samples and 419 µg/l after thirty minutes’ stagnation without induced air disturbance, and up to 612 µg/l first-flush with it. The increase was principally particulate.
The field trials were worse. Installing meters into genuinely old lead supply pipes at real properties produced peaks of between 573 and 9,700 µg/l. The researchers attributed the gap between rig and field to decades of accumulated lead compounds on the interior pipe wall and to the greater physical disturbance of manually manipulating an old pipe in the ground. They also noted that the size of the increase did not track the degree of disturbance consistently.
Flushing worked. Total and dissolved lead returned to approximately pre-installation values after the passage of 900 to 2,700 litres — three to nine days of typical use for a two-person household. The report recommended that where an installer establishes the service pipe is lead, the consumer should be told, given the water company’s standard lead advice, and advised to flush the cold supply for at least ten minutes immediately and then for two minutes at first use of the kitchen tap for the following three days.
That advice addresses disturbance. It does not address the joint left behind.
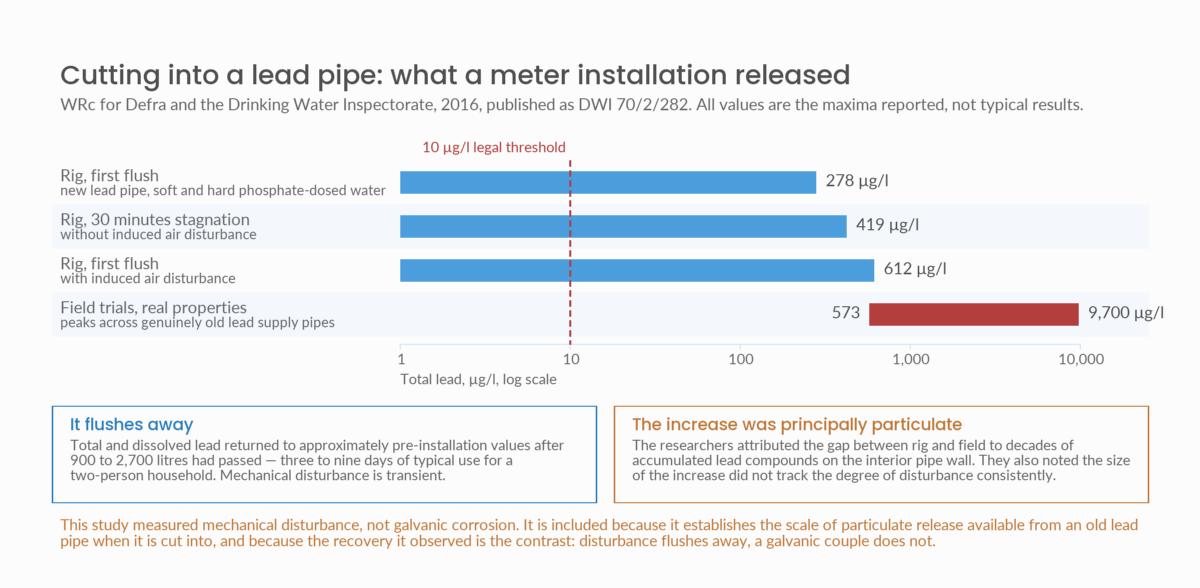
Figure 1. WRc for Defra and the Drinking Water Inspectorate, 2016, published as DWI 70/2/282. All values are the maxima reported, not typical results. This study measured mechanical disturbance rather than galvanic corrosion. It establishes the scale of particulate release available from an old lead pipe when it is cut into, and the recovery it observed is the contrast: disturbance flushes away, a galvanic couple does not.
What the joint actually looks like
The research literature measures partial lead service line replacement: a length of copper joined to a length of lead, one junction, usually at the boundary.[1,11] Internal alterations produce the same junction, and often more than one of it.
Where lead is replaced from a point onwards — a run taken back to a convenient joint and copper carried on from there — the sequence is lead, fitting, copper. One junction.
Where a section is taken out of the middle of a run and a new length joined at each end, the sequence is lead, fitting, copper, fitting, lead. Two junctions, with lead on the far side of both.
That second case matters because of what the sequence research found. Cartier et al. (2012) tested lead and copper in different orders and found the arrangement with lead downstream of copper released essentially as much lead as an unbroken lead pipe — 85 mg against 83 mg cumulatively — while being far more prone to particulate spikes at higher flow rates.[4] Lead downstream of a junction is not a configuration that was chosen. Wherever new copper is joined into a lead run, there is lead on the far side of it.
Wang et al. (2013) ranked coupling materials and found plain brass produced the highest release of both dissolved and particulate lead, with galvanic corrosion the primary cause of the particulate fraction.[14] Every junction in an alteration is a fitting, and the material of that fitting is the variable.
And brass is itself a lead source. The World Health Organization (2022) notes that bronze can contain up to 8% lead and behaves galvanically much as brass does.[18] UKWIR has run a research series specifically on brass fittings as a source of lead and nickel in hard and soft waters, with and without phosphate dosing. A brass fitting therefore does two things at once: it drives corrosion of the lead it touches, and it leaches from itself.
What has not been measured is the configuration itself. The published experimental work concerns single junctions in buried service lines. A short copper insert bracketed by two fittings within an internal lead run, with lead upstream and downstream of both, has not been measured by anyone.
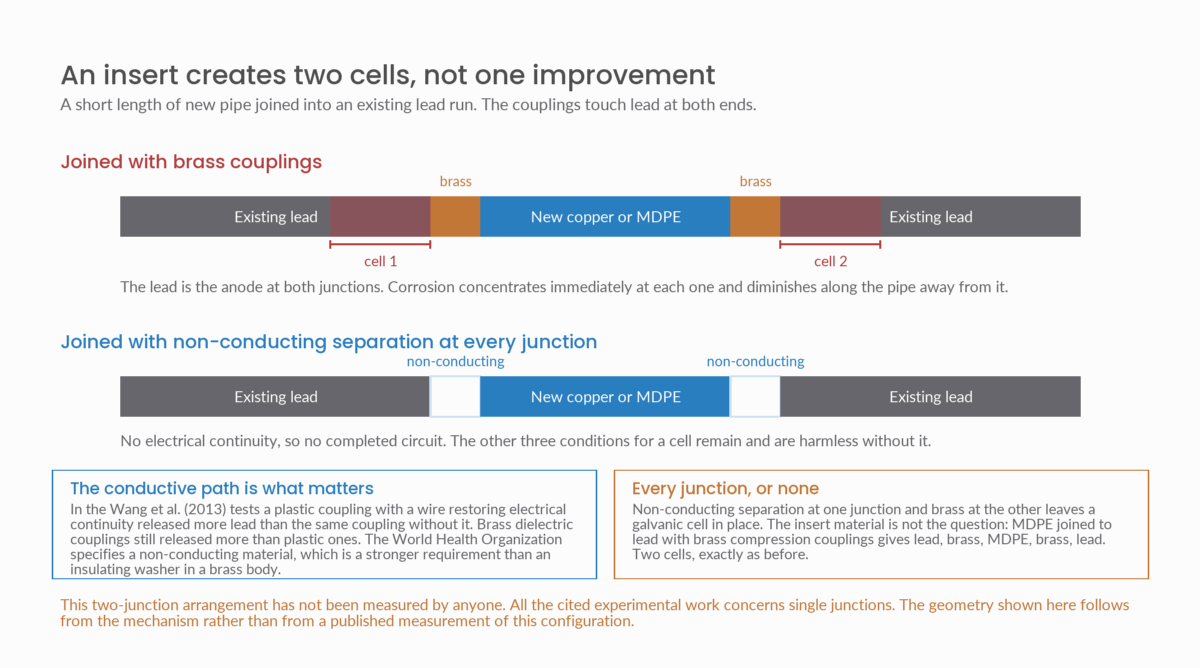
Figure 2. A short length of new pipe joined into an existing lead run touches lead at both ends, creating a galvanic cell at each junction rather than one improvement. The insert material is not the question: MDPE joined to lead with brass compression couplings gives lead, brass, MDPE, brass, lead. This two-junction arrangement has not been measured by anyone; all the cited experimental work concerns single junctions.
Why the joint is the part that does not flush away
The international research separates the two mechanisms a repair sets in motion. Wang et al. (2012) state it directly: enhanced lead release after partial replacement may be attributed to mechanical disturbance of the corrosion scales and also to galvanic corrosion, and while the former might be expected to have only a short-term effect, galvanic corrosion might result in an elevated lead level over a longer time.[13] The literature they review reports transient elevation lasting from a few days to several months.
Triantafyllidou and Edwards (2011), working on simulated partial replacements, found that a galvanic connection between lead pipe and copper increased lead release by between 1.1 and 16 times compared with an unbroken length of lead pipe, and that water chemistry governed the severity.[12] High chloride-to-sulphate water raised release by three to twelve times over less aggressive low-ratio water, with the galvanic current itself rising by half again to double as the ratio increased[12] — the same variable the 1985 British work had identified.
Wang et al. (2013) went further and tested the fitting itself. Comparing couplings used to join new copper to lead pipe harvested from Providence, Rhode Island, in recirculating flow with intermittent stagnation, they found lead release rose in a consistent order: plastic couplings lowest, then plastic with an external wire, then brass dielectric fittings, then plain brass highest. Both dissolved and particulate lead were higher with brass than with plastic.[14]
A Montreal pilot running 155 weeks on harvested lead service lines [6] found that lead concentrations did not fall in the long term following partial replacement at all.
Disturbance is transient: days, and it flushes. Galvanic corrosion is not, and where the joint remains, the driver remains.
Breaking the couple
The World Health Organization’s technical brief (2022) addresses this directly, in a section on separating galvanic couples. Where metals that form a galvanic couple with lead are disconnected, it reports, lead concentrations have been shown to fall by up to twenty times — citing Wang et al. (2013). Its specification is that a non-conducting material should separate lead from copper, brass, bronze and galvanised iron. It presents this as a remedial option that may be more accessible than others while remaining effective.
Read against what an alteration installs, the specification is unambiguous. The joint must have no metallic continuity with the lead, at every junction.
The Wang et al. (2013) experiment shows why the wording is[14] “non-conducting” rather than “non-metallic fitting”. The wired plastic coupling is the decisive case: same fitting, same pipes, one wire restoring electrical continuity, and lead release rose. What drives the cell is the conductive path.
Three consequences follow.
The insert material is not the question. MDPE joined to lead with brass compression couplings gives lead–brass–MDPE–brass–lead. Two cells, exactly as before, because the brass touches the lead at both ends.
A dielectric fitting appears not to be enough. Brass dielectric couplings — the conventional answer where dissimilar metals meet — still released more lead than plastic ones in the Wang tests. The WHO wording is that a non-conducting material should separate the metals, which is a stronger requirement than an insulating washer in a brass body.
Every junction, or none. Where an alteration creates two junctions, non-conducting separation at one and brass at the other leaves a galvanic cell in place.
Corrosion control cuts both ways
Almost all supplies in England and Wales are dosed with orthophosphate to control plumbosolvency, and it works. Cardew’s (2009) analysis of eleven years of data from the north west of England — some 14,000 lead analyses a year — found lead concentrations fell by around 90% as orthophosphate dosing was extended across the region, a result largely in accordance with theory.[3] The 90th-percentile lead concentration fell from 30.7 µg/l in 1995 to 2.93 µg/l in 2005.[3] Nothing in this article argues against orthophosphate dosing.
What that work also does is set out where lead at the tap comes from, and the categories matter here.
Cardew (2009) identifies three mechanisms by which a property on a lead service pipe contributes lead: dissolution of the corrosion layer; particulate lead caused by disturbance of the corrosion layer that forms between the water and the lead pipe; and particulate lead caused by adsorption of soluble lead onto particulate material in the water.[3] The first is the soluble component that orthophosphate is designed to control. The second is what happens when the pipe is physically interfered with.
He then states the concern directly. The two particulate mechanisms, he writes, account for the high lead concentrations observed, “and is of concern since if treatment only reduced the soluble component then particulate lead would increasingly become the dominant cause for exceedances of the standard.”
His data show orthophosphate does act on particulate lead, but by a different route and on a different timescale. The proportion of particulate lead fell significantly over the decade, which he attributes to improved mechanical robustness of the corrosion layer through changes in its physical structure — “a very slow process with a natural time-scale of years”. He notes that the impact of orthophosphate on particulate lead has not been quantified.
And the reduction is uneven across the distribution. Below the 90th percentile the improvement is largely constant, as the solubility model predicts. Above it, the reduction becomes increasingly smaller, and the explanation offered is that a significant number of those high concentrations are attributable to particulate lead, “which is not responding in the same way to orthophosphate as the soluble component[3]”. Over the ten years, he observes, the issue has shifted to higher and higher percentiles.
That last observation is the one worth dwelling on, because it points the wrong way for anyone assuming the lead problem is steadily solving itself. As corrosion control becomes more effective against the soluble component, particulate lead accounts for a growing share of what remains. A mechanism that generates particulate lead therefore becomes relatively more significant as treatment improves, not less.
Which is where the repair comes in.
Orthophosphate reduces particulate lead by making the corrosion layer physically harder to detach — slowly, structurally, over years. A repair works against that property in an afternoon. Cutting into the pipe detaches the layer mechanically, which is the second mechanism by name. And a galvanic couple then generates corrosion product which, as the 1986 final report put it, is morphologically different and easily released as particulate lead at concentrations greater than solubility.
The international work points the same way from the other end: in the Montreal pilot on harvested lead service lines, Cartier et al. (2013) found orthophosphate produced a thirteen-fold increase in total lead in the partially replaced configuration, attributable to the particulate fraction.[5]
The final report [21] entered a caution about treatment generally that is worth carrying forward — that dosing carries the possibility that it “only acts to delay the risk of unacceptable contamination”.
So the honest position is not that corrosion control fails on repaired pipes. It is that orthophosphate protects by two distinct routes operating on different timescales — rapidly on the soluble component, slowly and structurally on the particulate one — and a repair attacks the second while leaving the first intact. The protection cannot be assumed equivalent across intact and galvanically coupled configurations of the same pipe on the same supply.
One point of scope. Cardew was studying lead service pipes under normal supply conditions. He does not discuss galvanic corrosion, and nothing here should be read as his finding on it. What his work establishes is how particulate lead behaves under orthophosphate dosing in British supplies — which is the question a repair raises.
What the Regulations require
Schedule 2 of the Water Supply (Water Fittings) Regulations 1999 sets out the requirements for water fittings. Paragraph 2(1) prohibits the use of any material or substance likely to cause contamination of water in the construction, installation, renewal, repair or replacement of a water fitting conveying water for domestic or food production purposes. Repair and renewal appear in that list alongside new installation. There is no exemption for making good an existing lead pipe.[15]
Paragraph 3(a) requires that every water fitting be immune to or protected from corrosion by galvanic action, or by any other process likely to result in contamination or waste of water.[15]
Water Regs UK (no date), whose online guidance replaced the retired Water Regulations Guide, frames compliance with paragraph 3 in terms of system design and compatibility with other fittings in the system, giving the potential for galvanic action as its example. Its pipework guidance says pipe and fittings should be selected so that connections are configured to prevent galvanic action.[17]
Read together with the World Health Organization (2022) specification that a non-conducting material should separate lead from copper, brass, bronze and galvanised iron, the picture is coherent. A brass coupling joining new pipe to old lead establishes a galvanic couple. The evidence is that such a couple increases lead release, principally as particulates, and that the effect persists. Disconnecting the couple has been shown to reduce lead concentrations by up to twenty times.
This reading is an inference. No UK regulator or scheme operator has published a view on whether paragraph 3(a) applies where a fitting causes corrosion in adjacent pipework rather than corroding itself, and none has specified fittings for joining onto existing lead. None of which makes every alteration unlawful. It means the installer has a decision to make about materials and configuration, that the decision engages Schedule 2, and that “it was only a repair” is not a category the Regulations recognise.
Why this is hard to detect
If the release is particulate and apparently random, then the standard methods for finding lead problems will not reliably find this one. The final report [21] said so in terms.
On sampling: “The simple use of fixed time of stagnation samples is inadequate to assess exposure to galvanically corroded lead.”
On surveys, in a parenthesis: “Identification surveys will generally miss situations where high lead concentrations are caused by galvanic corrosion.”
Both follow from the mechanism. A fixed-stagnation sample measures accumulation over a known standing time, which is exactly how dissolved lead behaves and exactly how particulate lead does not. A sample drawn after thirty minutes’ stagnation will capture the soluble component reliably and the particulate component only by chance.
The recommended alternative was not a better single sample but a different approach altogether: detailed sampling of properties or model plumbing systems, interpreted alongside water consumption patterns, taking into account what the report called the random nature of the contamination [21].
That last point has a consequence for where the problem shows up. The report observed that with short and intensively used plumbing, severe contamination might last only a few weeks or months — as in very new domestic accommodation. With extensive and little-used plumbing, it might last many months or years, and it named schools, offices and hostels. Duration is governed by usage.
Two things follow for anyone assessing a property.
A negative result from a fixed-stagnation sample is weaker evidence than it appears. It rules out a soluble lead problem far more confidently than it rules out a galvanic one.
And a pattern of inconsistent results across a building — some samples over the legal threshold, some well under, no obvious explanation — is not necessarily a sampling failure. It is what the final report [21] predicted galvanic contamination would look like.
A case in point
In 2022 the London Borough of Lambeth (2022) assessed lead as a Category 1 hazard at Dorchester Court, a Grade II listed 1930s estate of 96 flats in Herne Hill.[9] Kitchen cold taps were sampled and analysed by a UKAS-accredited laboratory. On a single supply from a single main, twenty-four flats came in well under 1 µg/l, sixteen fell between 1 and 10, and forty-four exceeded the 10 µg/l legal threshold.[9] Lead was detectable in almost every flat.
The independent drinking water quality expert who assessed the results for the council reasoned from the same starting point as this article.[16] Because the supply is treated to reduce lead at the point of consumption under Regulation 29 of the Water Supply (Water Quality) Regulations 2016, the lead could only be coming from the pipework or the fittings. Same water, same treatment, same main — so whatever produced the spread lay downstream of the boundary, in the metal. The expert’s own explanation was flow and retention time in the lead pipework, particularly where longer runs are involved.
On flushing, the conclusion was blunt: an uncontrolled short-term measure; dependent on every occupant of every flat doing it; across 96 tenanted properties not a viable long-term solution; no guarantee of a reduction; and under some flow conditions it could increase it. The stated long-term answer was to remove the lead pipes.
Flushing works against dissolved lead, which is why the Drinking Water Inspectorate’s own research on meter installation [2] found three days of it sufficient after a disturbance. It works far less reliably against particulates. An expert assessing a real estate for enforcement purposes reached that conclusion from the sampling data alone.
The remedial schedule required a competent qualified plumber registered to a professional body to survey all piping, tanks and fittings, identify the lead, and either replace it or apply another recognised means of remediation, with a commissioning certificate or an agreed sampling exercise on completion.[9]
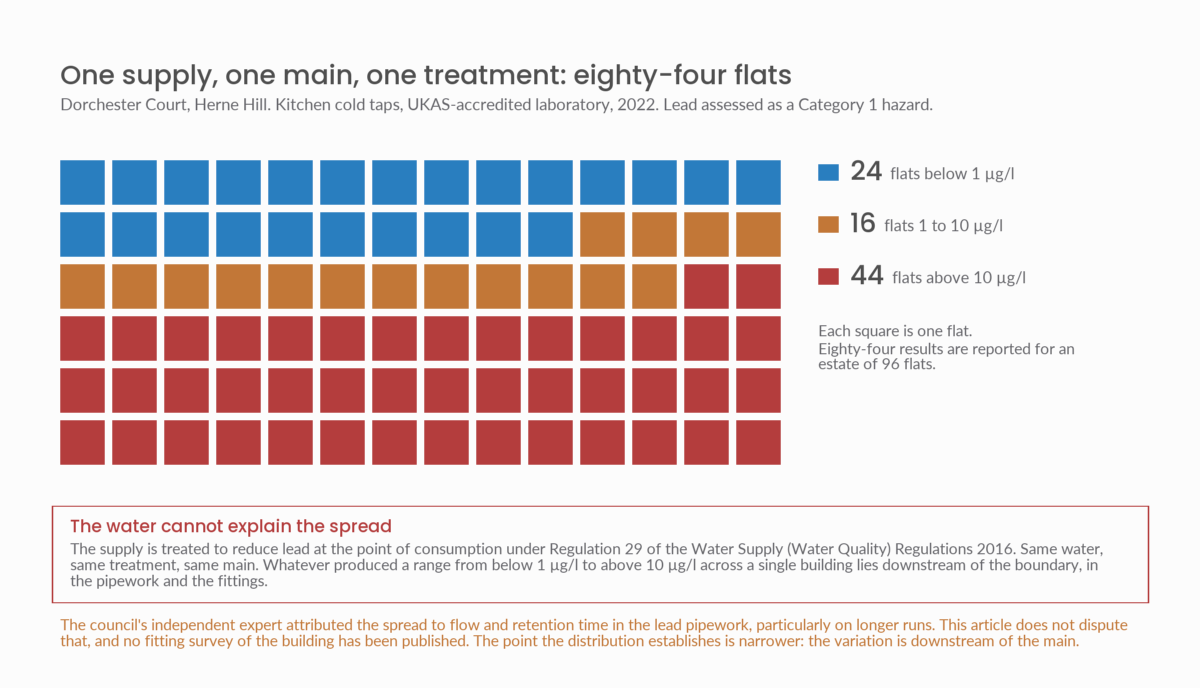
Figure 3. Dorchester Court, Herne Hill, 2022. Kitchen cold taps, UKAS-accredited laboratory. On a single supply from a single main, the results range from below 1 µg/l to above the 10 µg/l legal threshold. The council’s independent expert attributed the spread to flow and retention time in the lead pipework, and no fitting survey of the building has been published. What the distribution establishes is narrower: the variation lies downstream of the boundary.
Three outcomes, not two
An alteration to internal lead pipework has three possible outcomes, not two, and they are distinguishable in regulatory terms.
An alteration made with brass fittings leaves the lead in place and adds a galvanic cell at every junction. On the comparative research, that configuration can release as much lead as an unbroken lead pipe, and more of it as particulates.
An alteration with non-conducting separation at every junction leaves the lead but adds nothing. The World Health Organization (2022) reports up to a twentyfold reduction where couples are disconnected, and presents disconnection as a remedial option that is often more accessible than wholesale replacement.
Replacement removes the source.
The World Health Organization (2022) brief puts the general principle plainly: prevention is the most effective action to reduce exposure to lead through drinking water, and only low-lead or lead-free components should be used in new water systems.
Limitations of this analysis
Four limits should be stated explicitly.
The 1985 UK programme measured a different couple. It concerns lead solder in copper plumbing rather than lead pipe joined to copper.[8] The location is the same — internal plumbing — and the electrochemistry and water-chemistry drivers carry across, but the couple is not identical.
No UK measurement exists for internal lead joined to copper. The evidence on lead-to-copper junctions in service pipes is international — bench work, pilot rigs and harvested pipe from Providence, Washington DC and Montreal, across a range of water chemistries and including orthophosphate dosing. Nobody appears to have measured a lead-pipe-to-copper junction in British internal plumbing under British corrosion control. That is a gap in the published record rather than a reason to doubt the mechanism: the governing variable identified in thirty-eight UK supplies in 1985, the chloride-to-sulphate ratio, is the same variable that governs it internationally.
The two-junction configuration is unstudied. All the cited experimental work concerns single junctions. The arrangement created by an alteration — a short copper insert with lead upstream and downstream of two fittings — has not been measured by anyone.
The regulatory reading is an inference. Water Regs UK guidance is expressly informative and non-statutory.[17] No UK regulator or scheme operator has published a view on whether paragraph 3(a) applies where a fitting causes corrosion in adjacent pipework rather than corroding itself, and none has specified fittings for repairs to lead supply pipes. The specification in this article comes from the World Health Organization (2022) and from the comparative research, not from British guidance.
References
- Abokifa AA, Biswas P. Modeling soluble and particulate lead release into drinking water from full and partially replaced lead service lines. Environ Sci Technol. 2017;51(6):3318–26.
- Camm R, Jönsson J. Assessing the effect of water meter installation on exposure to lead in water. Report DEFRA10511.03. Swindon: WRc for Defra; 2016. Published by the Drinking Water Inspectorate as DWI 70/2/282, 2017.
- Cardew PT. Measuring the benefit of orthophosphate treatment on lead in drinking water. J Water Health. 2009;7(1):123–31.
- Cartier C, Arnold RB Jr, Triantafyllidou S, Prévost M, Edwards M. Effect of flow rate and lead/copper pipe sequence on lead release from service lines. Water Res. 2012;46(13):4142–52.
- Cartier C, Doré E, Laroche L, Nour S, Edwards M, Prévost M. Impact of treatment on Pb release from full and partially replaced harvested lead service lines. Water Res. 2013;47(2):661–71.
- Doré E, Deshommes E, Laroche L, Nour S, Prévost M. Study of the long-term impacts of treatments on lead release from full and partially replaced harvested lead service lines. Water Res. 2019;149:566–77.
- Gregory R. Galvanic corrosion of lead in copper pipework: phase I, measurement of galvanic corrosion potentials in selected waters. Report 392-S. Medmenham: WRc for the Department of the Environment; 1985. Published by the Drinking Water Inspectorate as DWI0097.
- Gregory R. Galvanic corrosion of lead solder in copper pipework. J Inst Water Environ Manag. 1990;4(2):112–18.
- London Borough of Lambeth. Improvement notice served on Dorchester Court, Herne Hill. Reproduced in appeal documents to planning application 20/01200/FUL. London: London Borough of Lambeth; 2022.
- Ng DQ, Chen CY, Lin YP. A new scenario of lead contamination in potable water distribution systems: galvanic corrosion between lead and stainless steel. Sci Total Environ. 2018;637–638:1423–31.
- St Clair J, Cartier C, Triantafyllidou S, Clark B, Edwards M. Long-term behavior of simulated partial lead service line replacements. Environ Eng Sci. 2016;33(1):53–64.
- Triantafyllidou S, Edwards M. Galvanic corrosion after simulated small-scale partial lead service line replacements. J Am Water Works Assoc. 2011;103(9):85–99.
- Wang Y, Jing H, Mehta V, Welter GJ, Giammar DE. Impact of galvanic corrosion on lead release from aged lead service lines. Water Res. 2012;46(16):5049–60.
- Wang Y, Mehta V, Welter GJ, Giammar DE. Effect of connection methods on lead release from galvanic corrosion. J Am Water Works Assoc. 2013;105(7):E337–51.
- The Water Supply (Water Fittings) Regulations 1999, SI 1999/1148, Schedule 2, paragraphs 2(1) and 3(a).
- The Water Supply (Water Quality) Regulations 2016, SI 2016/614, regulation 29.
- Water Regs UK. Schedule 2 paragraph 3: requirements for water fittings. Oakdale: Water Regs UK.
- World Health Organization. Lead in drinking-water: health risks, monitoring and corrective actions. Technical brief. Geneva: World Health Organization; 2022.
- WRc. Galvanic corrosion of lead in copper pipework: phase II, effects of treatment on galvanic corrosion potentials. Medmenham: WRc for the Department of the Environment; 1985. Published by the Drinking Water Inspectorate as DWI0098.
- WRc. Galvanic corrosion of lead in copper pipework: phase III, methods of dosing zinc to inhibit corrosion. Medmenham: WRc for the Department of the Environment; 1986. Published by the Drinking Water Inspectorate as DWI0319.
- WRc. Galvanic corrosion of lead in copper pipework — final report. PECD 7/7/711-158/83. Medmenham: WRc for the Department of the Environment; 1986. Published by the Drinking Water Inspectorate as DWI0017.
Disclosure
This article is published by London & Surrey Water Services Ltd, a CIPHE member and WaterSafe registered contractor whose business includes lead pipe replacement. The company therefore has a commercial interest in the subject matter. The article is restricted to findings and positions reported in the sources cited, and no claim is made here that is not traceable to those sources. It is not medical advice. Readers concerned about lead exposure should speak to their GP, and readers concerned about lead in their own water supply should contact their water supplier or seek independent laboratory testing.