
Abstract
Lead exposure in childhood is associated with adverse effects on neurodevelopment, cognition and behaviour at blood lead concentrations previously regarded as low. No threshold has been identified below which adverse effects can be excluded. In July 2021, England therefore reduced the public-health intervention concentration for children from 10 µg/dL to 5 µg/dL, bringing a substantially larger group of children within the scope of public-health investigation and case management.
The effect on surveillance was immediate. Cases reported through the Lead Exposure in Children Surveillance System (LEICSS) increased sharply following the change. In 2022, the first complete calendar year under the new definition, 191 children were reported, of whom 119 (62%) had blood lead concentrations between 5 and <10 µg/dL and would therefore have fallen below the former intervention concentration. More recent surveillance shows that detections at ≥10 µg/dL have also increased, indicating that the rise cannot be explained by the lower intervention concentration alone; increased clinical awareness and testing are also contributing to case ascertainment.
LEICSS, however, is a passive surveillance system rather than a population survey. It records children who are tested, identified and reported; it cannot determine the prevalence of elevated blood lead concentrations among children in England. UKHSA consequently states that there are no contemporary comprehensive survey data establishing how many children in England have blood lead concentrations ≥5 µg/dL. In the absence of such data, estimates vary substantially. UKHSA has illustrated the possible scale by applying recent US prevalence data to English children aged 1–5, producing an estimate of approximately 34,541, while Institute for Health Metrics and Evaluation modelling estimated that 213,702 people aged 0–19 in the UK had concentrations ≥5 µg/dL in 2019. These estimates differ in population, methodology and reference period and should not be interpreted as equivalent measurements of UK prevalence.
This article examines what is known about elevated blood lead concentrations in UK children, what changed when the intervention concentration was lowered, and why surveillance cannot answer the underlying prevalence question. It considers the UK approach to childhood lead screening, the distinction between clinical screening and representative population biomonitoring, and the evidence required to determine how many UK children currently have elevated levels of lead in their blood.
Table of Contents
1. Introduction
Lead exposure in children has declined substantially in the United Kingdom over recent decades, following measures including the removal of lead from petrol and restrictions on its use in paint and other products. That success can create the impression that childhood lead exposure has become principally a historical problem. It has not disappeared. Lead remains in the built environment, in contaminated soil and dust, in some consumer products and imported materials, and in legacy drinking-water plumbing. Children continue to be identified with blood lead concentrations sufficiently elevated to trigger clinical and public-health investigation.
The difficulty is establishing how many.
England has a defined public-health intervention concentration for childhood lead exposure. It has laboratory testing, clinical guidance and a national surveillance system for identified cases. Yet it does not currently have a nationally representative biomonitoring programme capable of measuring the distribution of blood lead concentrations across the child population. UKHSA states explicitly that there are no recent comprehensive survey data establishing how many children in England are exposed above the current intervention concentration.
This distinction between cases detected and children exposed is fundamental.
The Lead Exposure in Children Surveillance System is designed to identify children resident in England with elevated blood lead concentrations and initiate public-health action. It is a passive surveillance system. A child must first be tested and an elevated blood lead concentration detected before that child can enter the surveillance pathway. LEICSS can therefore describe the children who are being identified; it cannot provide a denominator from which the prevalence of elevated blood lead concentrations in the general child population can be calculated.
The importance of that distinction increased substantially in 2021.
Until 5 July 2021, the LEICSS surveillance definition required a blood lead concentration of at least 10 µg/dL (0.48 µmol/L). Following a review of evidence on the health effects of lower-level exposure, England halved the public-health intervention concentration to 5 µg/dL (0.24 µmol/L) for children under 16 and pregnant women. UKHSA describes 5 µg/dL as an intervention concentration: a concentration at which the finding is unlikely to represent background exposure and warrants investigation for an identifiable source.[7] It is not a biological boundary separating harmful from harmless exposure. UKHSA states that there is no defined safe threshold for the harmful effects of lead in children and recognises adverse neurobehavioural effects at concentrations of 5 µg/dL and below.
Lowering the intervention concentration changed the population of children captured by surveillance. In 2022, the first complete year operating at ≥5 µg/dL, LEICSS recorded 191 cases. Of these, 119 children (62%) had concentrations between 5 and <10 µg/dL, while 72 (38%) were at or above the former 10 µg/dL intervention concentration. The majority of children identified that year would therefore not have met the previous surveillance definition.
But the subsequent data reveal something more complicated than a simple threshold effect. By 2024, UKHSA reported that 159 cases (58%) were between 5 and <10 µg/dL, while 88 children were still being detected at ≥10 µg/dL. The latter number was unchanged from 2023 and higher than the 72 recorded in 2022. UKHSA considers this evidence that factors other than lowering the intervention concentration — including increased clinical awareness — have contributed to the increase in detected cases.
This raises a larger epidemiological problem. If the number of cases identified depends partly upon whether clinicians suspect lead exposure and request a blood test, then changes in reported cases cannot by themselves establish changes in underlying population exposure. A surveillance system can become better at finding a problem without the problem itself becoming more common.
In the absence of representative contemporary UK measurements, estimates of the underlying number are consequently very different from the number appearing in LEICSS. UKHSA’s 2025 report applied a US prevalence estimate of 1.1% among children aged 1–5 to the corresponding population in England and calculated that approximately 34,541 children might have blood lead concentrations ≥5 µg/dL. Separately, modelling by the Institute for Health Metrics and Evaluation estimated 213,702 UK children and young people aged 0–19 at or above 5 µg/dL in 2019, with an uncertainty interval of 186,117 to 281,542.
Neither figure is a measured contemporary prevalence count for UK children. Nor can either legitimately be compared directly with annual LEICSS case numbers: they concern different populations, age ranges, periods and epidemiological quantities.
That leaves a deceptively simple question without a direct empirical answer:
How many UK children currently have elevated levels of lead in their blood?
Answering it requires separating four things that are easily conflated: the concentration at which public-health intervention occurs; the number of children detected through surveillance; estimates of the underlying population prevalence; and the way in which the UK chooses to look for elevated blood lead in children in the first place.
The starting point is therefore the concentration itself: why England moved from 10 to 5 µg/dL, what that figure represents, and what it does not.
2. Blood Lead Levels in UK Children
Blood lead concentrations in UK children fell substantially during the final decades of the twentieth century. The best available historical evidence shows a pronounced decline from the mid-1980s into the 1990s, broadly coinciding with major reductions in environmental lead exposure, particularly the progressive removal of lead from petrol. Public Health England’s 2021 review concluded that this decline was substantial in both younger and older children, but also identified a fundamental limitation in the evidence base: England has not maintained a contemporary nationally representative childhood blood-lead monitoring programme.
The UK Blood Lead Monitoring Programme of 1984–87 provides some of the clearest evidence of the earlier decline. It repeatedly sampled children, principally around six to seven years old, in selected urban, heavily trafficked and rural control areas.[4] Approximately 1,000 children were intended to be tested each year, using venous blood analysed by atomic absorption spectrophotometry [2]. The programme documented marked year-on-year reductions in blood lead concentrations as environmental exposure fell, including a fall of approximately 16% between 1985 and 1986 [3]. These data are valuable for demonstrating the secular decline in childhood exposure, but they were not designed to provide a contemporary national prevalence estimate against today’s 5 µg/dL intervention concentration.
Regional studies from the same period provide a similar picture. A sample of 660 London schoolchildren tested in 1991–92 had a geometric mean blood lead concentration of 3.7 µg/dL, with values ranging from 1.0 to 15.0 µg/dL [5]. In the Avon Longitudinal Study of Parents and Children, 582 children aged around 30 months in the early 1990s had a mean blood lead concentration of 4.22 µg/dL, a median of 3.31 and a range of 0.83 to 27.56 [6]. These studies show that, although average concentrations had fallen considerably by the early 1990s, some children remained substantially above the population average. Neither study, however, was nationally representative, and summary statistics alone cannot be used reliably to reconstruct the proportion of children who would have exceeded today’s 5 µg/dL intervention concentration.
Public Health England’s reconstruction of historical UK studies found that blood lead concentrations had already declined sharply by the mid-1990s, reporting reductions of approximately 65% among children under six and 83% among older children compared with concentrations measured in the mid-1980s [1]. Similar downward trends continued in other high-income countries after leaded petrol had been removed, although generally at a slower rate than during the earlier period.
The difficulty is that the UK evidence becomes much thinner precisely where the contemporary question begins.
PHE stated in 2021 that population surveys are the more reliable way to estimate population exposure to lead, but that there were no recent representative survey data estimating the number of children in England exposed to lead. The last such population data dated from the 1990s. In the absence of contemporary English measurements, the working group had to use trends observed in other high-income countries to infer how childhood blood lead concentrations in the UK were likely to have changed.
The evidence available since then does not close that gap. LEICSS provides detailed information on children who have been clinically tested, detected and reported in England, but it is passive surveillance rather than population biomonitoring. Wales now publishes data from clinically requested NHS blood lead testing, but those children are also selected for testing and therefore cannot be treated as a representative sample of the Welsh child population. ECLIPS, launched in Leeds in 2025, is beginning to test a different approach using household recruitment and microsampling, but no prevalence result had been published at the time of this review.
The historical evidence therefore establishes two things with reasonable confidence. First, childhood blood lead concentrations in the UK fell dramatically during the final decades of the twentieth century. Second, that success was not followed by a continuing national childhood biomonitoring programme capable of showing where the distribution sits today.
As a result, the UK can describe the downward historical trend far more confidently than it can answer the contemporary question: what proportion of children now have blood lead concentrations at or above 5 µg/dL?
3. The 5 µg/dL Intervention Concentration
In England, the concentration used to trigger public-health action following childhood lead exposure was historically 10 µg/dL (0.48 µmol/L). In 2021, Public Health England reviewed whether that concentration remained appropriate in light of evidence that adverse effects occur at substantially lower blood lead concentrations. The review concluded that it did not. From 5 July 2021, the public-health intervention concentration for children under 16 years of age, and for pregnant women, was reduced to 5 µg/dL (0.24 µmol/L). The concentration triggering local public-health action for other adults remained at 10 µg/dL [1].
The distinction between an intervention concentration and a threshold for toxicity is important. The reduction to 5 µg/dL did not establish a new boundary below which lead exposure is considered harmless. PHE’s review treated lead as a non-threshold contaminant and concluded that the available evidence did not identify a blood lead concentration below which adverse effects could be excluded. The 5 µg/dL concentration was instead selected as an operational level at which an individual child’s result should trigger public-health investigation and action.
The evidence considered by PHE was particularly concerned with neurodevelopment. Its review found strong evidence for adverse cognitive effects at blood lead concentrations below 5 µg/dL, together with evidence of externalising behaviours and delayed sexual maturation or puberty onset at concentrations below 10 µg/dL. Importantly, the relationship between blood lead and cognitive outcomes was not interpreted as a simple linear relationship in which progressively lower exposures produced proportionately negligible effects. PHE described evidence of a supra-linear dose-response relationship, with proportionally greater harm incurred by initial lower-level exposures than by subsequent higher exposures.
This matters because the former 10 µg/dL concentration had increasingly become difficult to interpret as a meaningful boundary for public-health intervention. A child with a blood lead concentration of 9 µg/dL was not thereby protected from effects that might occur at 10 µg/dL or above. Nor did reducing the intervention concentration to 5 µg/dL imply that a child at 4 µg/dL was free from lead-related risk. PHE stated this directly: a blood lead concentration of less than 5 µg/dL is still associated with adverse health effects.
PHE therefore had to address a different question: not “At what blood lead concentration does harm begin?”, but “At what concentration should an individual result trigger public-health action?”
That distinction is reflected in the terminology adopted elsewhere. PHE’s review notes that Germany lowered its action level in 2010 and that the United States Centers for Disease Control and Prevention followed in 2012, and that both adopted a new term — the reference value — because no lower threshold for the adverse effects of lead exposure had been demonstrated. Recognising that any exposure to lead may be harmful, reference values were instead set to identify unusually high exposure within a population, which may be more likely to arise from a specific source. PHE records that France, Australia and Wales took a similar approach.
England’s 5 µg/dL is a value of that kind. UKHSA describes it as a concentration at which a child’s blood lead result is unlikely to represent background exposure and where investigation should be undertaken to identify and reduce continuing sources. Public-health management may include a detailed exposure history, environmental investigation, identification of potential sources and action to prevent further exposure.
Reference values, surveillance definitions and clinical intervention concentrations are not interchangeable. A population reference value may identify children whose blood lead concentrations are high relative to their peers; an intervention concentration determines when a public-health response is initiated. Neither necessarily represents a toxicological threshold.
There is one further point about what the 5 µg/dL figure was calculated from, and it bears directly on the argument of this article. PHE had no contemporary English measurement to work from. Because there had been no representative survey of children’s blood lead in England since the 1990s, the working group searched for surveys in other high-income countries and used the trends observed there to infer how concentrations were likely to have changed in the UK and where the population range might now lie. The judgement that a 5 µg/dL threshold would identify children in approximately the top 2% of the population range therefore rests on inference from French, German, American, Australian and Swedish data rather than on a measurement of English children.
The practical consequence of the 2021 decision was substantial. Before 5 July, a child generally needed a confirmed blood lead concentration of at least 10 µg/dL to meet the LEICSS case definition. After the change, children between 5 and <10 µg/dL entered the surveillance and public-health management system as confirmed cases.
The significance of that newly included concentration range became apparent as soon as a complete year of surveillance data became available. In 2022, 119 of the 191 children reported to LEICSS — 62% of all cases — had blood lead concentrations between 5 and <10 µg/dL. Only 72 children were at or above the former 10 µg/dL intervention concentration.
The majority of children identified through LEICSS that year would therefore have fallen below the previous intervention concentration.
That does not mean that lowering the concentration created a new population of lead-exposed children. Those blood lead concentrations existed irrespective of the surveillance definition. What changed was the point at which England formally recognised an individual result as requiring public-health investigation.
The distinction becomes particularly important when interpreting the sharp increase in LEICSS cases after 2021. Part of that increase is an inevitable consequence of including children between 5 and <10 µg/dL. But, as the subsequent surveillance data show, the threshold change does not explain the whole increase. To understand what happened after 2021, it is first necessary to examine how LEICSS identifies and counts childhood lead exposure.
Figure 1. The rapid overview of reviews conducted to inform the English threshold identified 1,874 records and included none of them. All thirteen studies reaching quality assessment were judged to give critically low confidence. The working group fell back on the Australian NHMRC 2015 overview, which rests on the US National Toxicology Program monograph and the US Environmental Protection Agency Integrated Science Assessment. This does not make the decision wrong; it means the review conducted for the purpose contributed nothing to it, as the report states in its own appendix.
4. Lead Exposure in Children Surveillance System (LEICSS)
The Lead Exposure in Children Surveillance System is England’s national surveillance system for children with elevated blood lead concentrations. It was established to improve the identification and public-health management of childhood lead exposure and to provide a national picture of cases detected through clinical and laboratory pathways. It is operated by the UK Health Security Agency, having previously been administered by Public Health England.
Formal surveillance of childhood lead exposure in England began in 2010 with the Surveillance of elevated blood Lead in Children study, a collaborative project involving the British Paediatric Surveillance Unit and the Health Protection Agency. Its authors recommended establishing a laboratory-based surveillance system to enable timely public-health management of cases. A pilot, the Lead Poisoning in Children surveillance system, was instigated in 2014 and, following evaluation, permanently implemented as LEICSS in 2016.
A note on the annual reports is necessary before the figures are presented. UKHSA titles each LEICSS annual report by its year of publication, while the report covers the preceding calendar year. The annual report for 2025 therefore presents surveillance data for 2024; the 2024 report presents data for 2023; the 2023 report presents data for 2022; and the 2022 report presents data for 2021. References throughout this article follow that convention and state the data year.
LEICSS does not routinely test children itself. Cases enter the system after a child has had a blood lead test through clinical care or investigation and the result reaches the surveillance system. In 2024, 223 of the 247 confirmed cases — around 90% — were identified through direct laboratory reporting, with the remainder reaching surveillance through other routes.[8]
The pathway into LEICSS therefore begins before surveillance itself. A child may have symptoms, developmental or behavioural concerns, pica, a recognised environmental exposure or another risk factor that prompts a clinician to consider lead. A blood sample must then be requested and successfully obtained, lead must be measured, the result must be reported, and the child must meet the surveillance case definition. In simplified form:
possible exposure, symptom or risk factor → clinical recognition → decision to test → blood sample → laboratory result → reporting → case-definition assessment → LEICSS case
Each stage matters. A child with an elevated blood lead concentration who is never tested cannot appear in LEICSS.
This is why LEICSS is described as a passive surveillance system, rather than a screening or population biomonitoring programme. Its annual figures measure the number of qualifying children who were identified and reported through the surveillance pathway. They do not measure the number of children in the general population with elevated blood lead concentrations.
Annual LEICSS cases
The current harmonised UKHSA series provides comparable annual case totals from 2015. During the six complete years before the intervention concentration was lowered, annual numbers were relatively small, ranging from 33 to 49 cases. The surveillance definition during this period required a blood lead concentration of at least 10 µg/dL.
| Year | LEICSS cases | Case definition |
|---|---|---|
| 2015 | 33 | ≥10 µg/dL |
| 2016 | 33 | ≥10 µg/dL |
| 2017 | 49 | ≥10 µg/dL |
| 2018 | 45 | ≥10 µg/dL |
| 2019 | 36 | ≥10 µg/dL |
| 2020 | 35 | ≥10 µg/dL |
| 2021 | 121 | ≥10 µg/dL to 4 July; ≥5 µg/dL from 5 July |
| 2022 | 191 | ≥5 µg/dL |
| 2023 | 226 | ≥5 µg/dL |
| 2024 | 247 | ≥5 µg/dL |
The series contains 1,016 recorded cases between 2015 and 2024, but that total should not be interpreted as a single epidemiologically consistent decade of surveillance. The case definition changed substantially midway through the period.
Between 2015 and 2020, LEICSS recorded 231 cases, an average of 38.5 per year. In 2021, the transition year, the total increased to 121. The annual report for that year records 31 cases notified before the case definition changed on 5 July and 90 afterwards.[9]
The increase continued during the first three complete years under the ≥5 µg/dL definition: 191 cases in 2022, 226 in 2023 and 247 in 2024. Together, those three years produced 664 confirmed cases, an average of 221.3 per year, compared with 38.5 per year during 2015–20. The annual number of children detected was therefore approximately 5.75 times higher in the first three complete years under the new definition.
That comparison needs careful interpretation. It does not show that childhood lead exposure in England increased nearly sixfold. Part of the discontinuity is built into the surveillance system itself: from July 2021, children with blood lead concentrations between 5 and <10 µg/dL became eligible for inclusion when previously they had not been.
There is also a technical reason to use the current UKHSA series rather than assembling figures from successive archived annual reports. LEICSS is a live surveillance system, and historical records have undergone small retrospective revisions as cases were reconciled and de-duplicated. All four recent annual reports carry the same last-updated date, and the collection page records subsequent corrections and additions. The current harmonised series is therefore the more appropriate basis for comparing annual totals.
The latest data also illustrate the difference between reports received and confirmed LEICSS cases. In 2024, UKHSA received 275 reports, of which 247 met the surveillance definition. The national case-detection rate was 23 cases per million children aged 0–15 years.
Again, that is a detection rate, not an estimate of prevalence. The denominator describes the population from which detected cases arose, but the numerator depends upon which children were tested and reported. LEICSS is therefore well suited to monitoring identified cases, supporting public-health investigation and observing changes in case detection. It cannot, by itself, establish how many children in England have blood lead concentrations above the intervention concentration.
The change in case definition nevertheless created an opportunity to examine something more specific. From 2022 onwards, the published blood lead distributions allow children between 5 and <10 µg/dL to be separated from those who would still have met the former ≥10 µg/dL definition. That comparison shows much more clearly what happened when England lowered its intervention concentration.
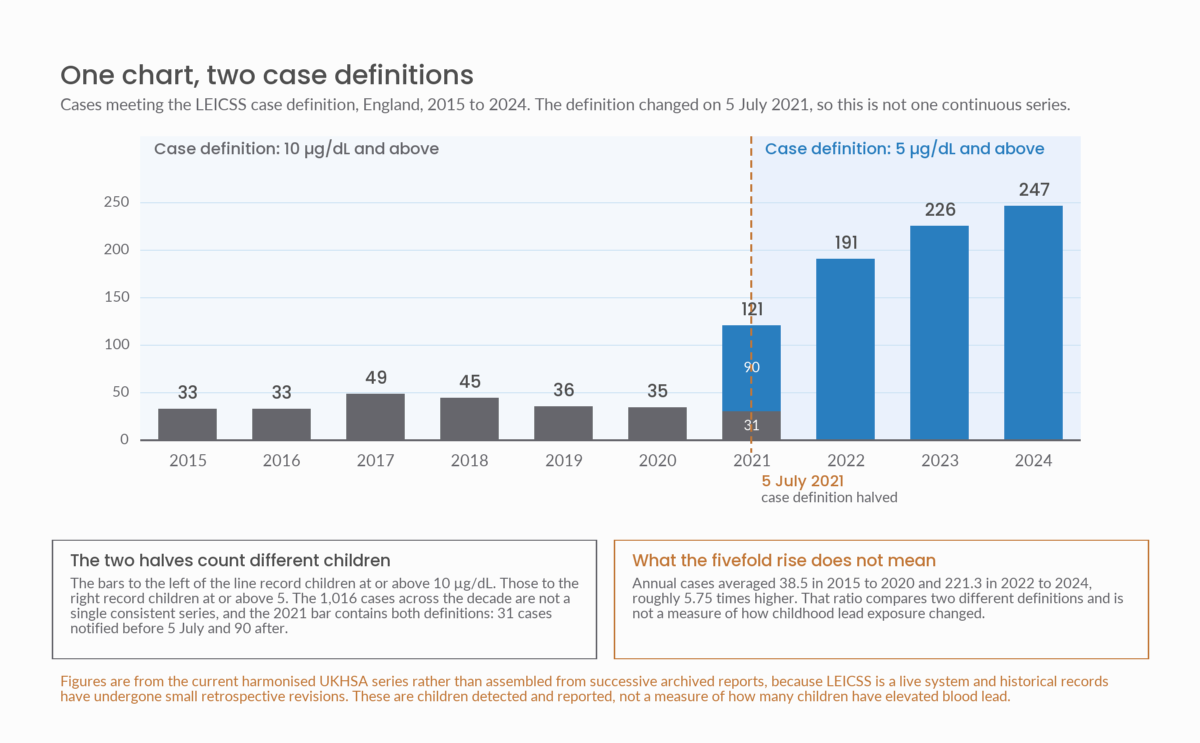
Figure 2. The case definition changed on 5 July 2021, so the decade is not one continuous series. The 2021 bar contains both definitions: 31 cases notified before the change and 90 after. Comparing the 2015 to 2020 average of 38.5 cases a year with the 2022 to 2024 average of 221.3 compares two different definitions and is not a measure of how childhood lead exposure changed.
5. The Effect of Lowering the Intervention Concentration
The reduction of England’s public-health intervention concentration from 10 µg/dL to 5 µg/dL on 5 July 2021 created a clear break in the LEICSS surveillance series. Before the change, children with blood lead concentrations between 5 and <10 µg/dL did not meet the surveillance case definition. Afterwards, they did. The increase in reported cases was therefore expected to some degree simply because the population eligible for inclusion had expanded.
The difference between the two periods is substantial. During the six complete years from 2015 to 2020, when the LEICSS definition was ≥10 µg/dL, England recorded 231 cases, equivalent to an average of 38.5 cases per year. The transition year of 2021 recorded 121 cases. In the first three complete years operating at ≥5 µg/dL, LEICSS recorded 191 cases in 2022, 226 in 2023 and 247 in 2024: 664 cases in total, or an average of 221.3 per year. The annual average of detected cases was therefore approximately 5.75 times higher than during 2015–20.
That comparison does not mean that the prevalence of childhood lead exposure increased nearly sixfold. The surveillance definition itself changed. The more informative question is therefore not simply how many additional cases appeared, but where their blood lead concentrations lay in relation to the old 10 µg/dL intervention concentration.
The first complete year after the change provides the clearest answer. Of the 191 confirmed LEICSS cases in 2022, 119 children had blood lead concentrations between 5 and <10 µg/dL, while 72 were at or above 10 µg/dL. Among confirmed cases, the newly included concentration band therefore accounted for 62.3% of the total. UKHSA described this directly as a result of the case definition change, noting that the 5 to 10 µg/dL group was almost double the number of cases at or above 10 µg/dL.[10]
The same pattern continued in subsequent years. In 2023, 138 of 226 cases were between 5 and <10 µg/dL, compared with 88 at ≥10 µg/dL. In 2024, 159 of 247 cases were between 5 and <10 µg/dL, while 88 remained at or above 10 µg/dL. Expressed as a proportion of confirmed cases, the 5–<10 µg/dL group represented 61.1% in 2023 and 64.4% in 2024.
Across the three complete years from 2022 to 2024, the distribution was therefore:
| Blood lead concentration | Confirmed LEICSS cases | Share of cases |
|---|---|---|
| 5–<10 µg/dL | 416 | 62.7% |
| ≥10 µg/dL | 248 | 37.3% |
| Total | 664 | 100% |
This is perhaps the clearest measure of what lowering the intervention concentration changed. 416 children identified during 2022–24 had blood lead concentrations that met the current LEICSS definition but would have fallen below the former ≥10 µg/dL case definition.
The phrase “would have fallen below” requires some care. It does not necessarily mean that every one of those children would never have come to the attention of health services under the previous system. A clinician could still have tested a child, identified lead exposure or sought specialist advice below the formal intervention concentration. What can be said directly is that these children would not have met the former LEICSS surveillance case definition on the basis of their blood lead concentration.
The effect is also visible during the transition year itself. The 2021 data record 31 cases before 5 July and 90 after the new definition came into force. The two periods are not identical in length and cannot be treated as a controlled before-and-after experiment, but the increase is consistent with the expected effect of broadening the qualifying concentration range.
There is a further complication in interpreting the published percentages. Recent UKHSA blood-lead tables include reports below 5 µg/dL that did not satisfy the LEICSS case definition. In 2022, the published distribution included 21 such reports; there were 35 in 2023 and 28 in 2024. If those reports are retained in the denominator, the published proportion in the 5–<10 µg/dL band appears lower. For the narrower question being asked here — what proportion of confirmed LEICSS cases lay between the new and old intervention concentrations? — the appropriate denominators are the confirmed case totals of 191, 226 and 247. This gives 62.3%, 61.1% and 64.4% respectively.
The post-2021 increase therefore has an obvious definitional component. Lowering the intervention concentration brought a large group of children between 5 and <10 µg/dL within formal surveillance, and those children have consistently accounted for around three-fifths of confirmed cases.
But the distribution also reveals something the threshold change alone cannot explain. The number of children detected at ≥10 µg/dL — who would have qualified under either definition — was 72 in 2022 and 88 in both 2023 and 2024. Those figures are themselves substantially higher than the 33–49 total annual cases recorded during the years when ≥10 µg/dL was the case definition.
In other words, England has not simply added a new 5–<10 µg/dL group to an otherwise unchanged surveillance system. It is also finding more children at concentrations that would have met the old definition.
That is critical to understanding the rise in LEICSS cases. Lowering the intervention concentration made previously excluded children formally visible to surveillance, but it does not account for all of the increase. Changes in clinical awareness, testing and case ascertainment also appear to be important.
Figure 3. The lighter bars are children brought into surveillance by the 2021 change. The darker bars are children at or above 10 µg/dL, where the threshold did not move — and in every year since 2022 that group alone exceeds the total annual caseload of the entire system before 2021. That is the part the definition change cannot explain.
6. Testing and Case Detection
The increase in LEICSS cases after 2021 cannot be explained solely by the reduction in the intervention concentration. If the change from 10 to 5 µg/dL were the only important factor, the principal effect would be the addition of children in the newly included 5–<10 µg/dL range, while the number detected at ≥10 µg/dL might be expected to remain broadly comparable with the earlier period. That is not what the surveillance data show.
Between 2015 and 2020, when ≥10 µg/dL was itself the LEICSS case definition, England recorded between 33 and 49 cases per year, with an annual average of 38.5. These totals effectively represent children meeting the old ≥10 µg/dL definition. By contrast, after the intervention concentration was lowered, LEICSS identified 72 children at ≥10 µg/dL in 2022, 88 in 2023 and 88 in 2024.
The number of children being identified above the old intervention concentration has therefore approximately doubled relative to the pre-2021 annual average.
This does not demonstrate that severe or higher-level childhood lead exposure itself doubled. It demonstrates that more children with blood lead concentrations ≥10 µg/dL are now being detected by the surveillance system.
That distinction is central to interpreting LEICSS.
A surveillance case can only exist after a child has been tested. Blood lead testing in England is not performed routinely across the child population. It generally follows clinical suspicion, recognised risk factors or an environmental investigation. Consequently, the number of cases reported by LEICSS is partly a function of the underlying occurrence of elevated blood lead and partly a function of the probability that an exposed child will be recognised and tested.
The surveillance pathway therefore contains an important ascertainment effect:
more clinical recognition → more blood lead tests → more opportunities to detect elevated BLCs → more LEICSS cases
The experience in Leeds provides unusually useful evidence of this effect.
The Leeds experience
The Leeds Supra-regional Assay Service laboratory introduced an alert on its electronic test-request system prompting clinicians to consider blood lead testing in children with suspected pica and iron deficiency. The intervention followed the death of a lead-exposed child and was accompanied by clinician education [11].
The subsequent change was substantial. UKHSA reports that the introduction of the alert increased blood lead test requests by approximately 90% in 2017, accompanied by increased identification of children with elevated blood lead concentrations. Crabbe and colleagues report the same 90% increase in test requests during the twelve months following its introduction, and note that this may partly explain the higher case incidence observed in Yorkshire and the Humber.
The environmental lead burden of Leeds did not need to change for the number of identified children to rise. What changed was the probability that clinicians would consider lead exposure and request a blood test.
That experience is particularly relevant because Yorkshire and the Humber now has by far the highest LEICSS case-detection rate in England. In 2024, the national rate was 23 detected cases per million children aged 0–15, while Yorkshire and the Humber recorded approximately 93–94 cases per million — around four times the English rate, and 39% of all reported English cases. At the other extreme, the East of England recorded 7 cases per million.
At first sight, such a geographical difference might suggest that childhood lead exposure is four times as common in Yorkshire and the Humber. LEICSS cannot support that conclusion.
UKHSA specifically cautions against interpreting regional case-detection rates as regional prevalence, stating that the substantial differences observed across regions are likely due to bias in case ascertainment rather than a reflection of incidence or prevalence rates. The experience in Leeds provides a concrete example of how substantially changing clinical practice can alter the number of cases that surveillance subsequently sees.
This does not mean that the Yorkshire and the Humber excess is entirely an artefact of testing. Environmental exposures may also differ geographically. The available surveillance data cannot separate those effects sufficiently to determine how much of the regional variation represents underlying prevalence and how much represents differences in detection.
The importance of clinical suspicion
The problem is particularly important at lower blood lead concentrations. Childhood lead exposure does not necessarily produce a distinctive clinical presentation. Overt manifestations of toxicity, such as anaemia or abdominal pain, are generally associated with higher concentrations, for example above approximately 30 µg/dL. Children at lower concentrations may be asymptomatic, while possible effects such as developmental difficulties, behavioural problems or impaired cognition have many other potential causes. Unless lead exposure is considered as part of the differential diagnosis or an environmental risk is recognised, a blood lead test may never be requested.
This creates a selection mechanism within LEICSS. Children with recognised risk factors — such as pica, developmental concerns, known exposure to deteriorating lead paint or contaminated soil, occupational exposure within the household, or another identifiable environmental source — are more likely to be tested than children whose exposure is unsuspected. In 2024, 94% of children with a completed enhanced surveillance questionnaire had recorded pica behaviour, and 74% had diagnosed learning difficulties.
The resulting surveillance population is therefore not a random sample of English children. It is a population selected through clinical and environmental recognition.
This also helps explain why the fall in the median blood lead concentration among reported cases after 2021 should be interpreted cautiously. UKHSA reports median concentrations among laboratory-detected cases of approximately 0.71 µmol/L during 2015–20, compared with 0.48 µmol/L in 2021, 0.37 µmol/L in 2022, 0.39 µmol/L in 2023 and 0.37 µmol/L in 2024. But the population eligible for surveillance changed at the same time: from July 2021 the system deliberately began including children with lower concentrations. The falling median among reported cases therefore cannot be read as equivalent evidence of a fall in population exposure.
The opposite problem applies to the rising number of cases. More detected cases do not necessarily mean that population exposure is increasing.
LEICSS is measuring the intersection of two things: children who have elevated blood lead concentrations, and children whose elevated blood lead concentrations are actually discovered.
The ≥10 µg/dL data make that particularly clear. The intervention concentration changed, but 10 µg/dL did not. Yet England is now identifying substantially more children above that unchanged concentration than it did before 2021. Increased ascertainment must therefore form at least part of the explanation.
This has an important consequence for the central question of how many UK children have elevated levels of lead in their blood. Annual surveillance counts cannot provide the answer unless the probability of detecting an affected child is known.
In England, it is not.
The number of children appearing in LEICSS depends partly on how frequently clinicians think to look for lead in the first place. Leeds demonstrates what can happen when that probability is deliberately increased: testing rises, and more children are found.
That leads directly to a broader question. If elevated childhood blood lead can remain clinically unrecognised unless somebody decides to test for it, how does the UK systematically look for affected children? The answer requires examining the country’s approach to childhood lead screening.
7. Screening for Lead Exposure in the UK
The limitations of passive surveillance raise an obvious question: if elevated blood lead may be clinically silent and detection depends upon a clinician deciding to request a test, why are children in the UK not routinely screened for lead exposure?
Population screening for childhood lead exposure is not currently recommended by the UK National Screening Committee. The most recent completed review was published in 2018 and concluded that the evidence did not support introducing a national screening programme.[12] The decision applied across the UK screening policy framework rather than representing a LEICSS decision: LEICSS is an English surveillance system for cases that have already been detected, whereas the UK NSC considers whether apparently healthy populations should systematically be offered screening.
The distinction matters. A surveillance system asks what can be learned from cases that reach health services. A screening programme deliberately seeks to identify a condition in people who have not necessarily presented with symptoms. Introducing childhood lead screening would therefore represent a fundamentally different approach to case finding.
The 2018 review
The 2018 UK NSC review considered whether asymptomatic children aged 1–5 years should be screened for elevated blood lead concentrations. Its conclusion was not based on a claim that childhood lead exposure was harmless or had disappeared from the UK. Rather, the committee identified weaknesses at several points in the pathway required for a population screening programme.
One problem was basic epidemiology. The review found no new UK prevalence studies and insufficient contemporary evidence on the prevalence and distribution of elevated blood lead concentrations among UK children. Much of the UK evidence was old, geographically restricted or derived from selected populations rather than representative national sampling. As discussed earlier, this remains a significant limitation: the last representative childhood blood-lead population data for England date from the 1990s.
This creates an unusual difficulty for screening policy. To assess the likely benefits, harms, workload and cost-effectiveness of a screening programme, it is useful to know how common the condition being sought actually is. Yet the absence of representative biomonitoring means that the contemporary UK prevalence of elevated childhood blood lead is itself uncertain.
The UK NSC also considered the suitability of the screening test and pathway. Blood lead concentration can be measured directly, but the practical question for screening is not simply whether a laboratory can measure lead accurately. A population programme requires an acceptable method of obtaining samples from large numbers of otherwise healthy young children.
The review specifically identified contamination and sensitivity and specificity problems with capillary testing. Lead present on the skin can contaminate a finger-prick sample unless collection procedures are carefully controlled, and positive capillary results may therefore require confirmation using a venous sample. Venous sampling reduces that particular contamination problem but is more invasive and more difficult to use as the first-line test in a population of very young children.
The review also identified the absence of an appropriate cut-off, because no safe blood lead level has been established; the poor performance of risk-based screening questionnaires; and insufficient evidence of treatment benefit.
This is important because the 2018 conclusion should not be reduced to the claim that “blood lead tests are unreliable.” Laboratory measurement of lead and the performance of a practical population screening pathway are separate issues. A questionnaire that fails to identify a substantial proportion of children with elevated concentrations has limited value as the gatekeeper to testing, while a very broad questionnaire may generate large numbers of children requiring blood sampling.
What happens after a child is identified?
The UK NSC also examined whether identifying mildly elevated blood lead concentrations through screening would lead to interventions that produced sufficient benefit to justify the programme.
This issue requires careful interpretation because there is no medical treatment that can reverse neurodevelopmental injury already caused by lead. Chelation has an established role at substantially higher blood lead concentrations, but it is not a treatment for the much lower concentrations that a population screening programme would predominantly identify.
The 2018 review did, however, consider environmental intervention and removal of the source of exposure. The screening decision should therefore not be characterised simply as: there is no treatment for low-level lead exposure, so the UK decided not to look for it. The actual question was whether screening, followed by the available interventions, had sufficient evidence of improved outcomes to satisfy the criteria for a national population screening programme.
That distinction became a point of debate during consultation. Respondents argued that identifying an elevated blood lead concentration can itself enable action to locate and remove an ongoing source of exposure, thereby preventing further exposure even where previous neurological effects cannot be reversed. The question is therefore not limited to whether a pharmaceutical treatment lowers blood lead. It also concerns whether earlier identification leads to sufficiently effective environmental intervention and improved outcomes to justify screening children who would otherwise not have been tested.
The UK NSC ultimately concluded that the available evidence did not establish a sufficiently favourable balance of benefits and harms for population screening.
What has changed since 2018?
The evidence and policy environment have not remained static.
Most obviously, England subsequently halved its public-health intervention concentration. The 2018 screening review was completed when 10 µg/dL remained the intervention concentration used by LEICSS. Since July 2021, England has intervened at 5 µg/dL, following PHE’s conclusion that adverse effects occur below that concentration and that no threshold for harm could be identified.
LEICSS has also accumulated several years of surveillance under the lower definition. As the preceding sections show, hundreds of children between 5 and <10 µg/dL have subsequently entered surveillance, while detection of children at ≥10 µg/dL has also increased.
Clinical case-finding has changed too. The Leeds experience provides evidence that electronic prompting can substantially increase blood lead testing and case detection. And newer microsampling approaches are now being used in ECLIPS to investigate whether blood lead measurement can be made more practical outside conventional venous clinical testing.
None of these developments proves that universal childhood screening would now satisfy UK NSC criteria. They do, however, mean that some of the evidence relevant to the screening question has changed since the last completed review.
There has also been an important change to the remit of the UK NSC itself. Since 2022, the committee has been able to consider not only whole-population screening programmes but also targeted and stratified screening.
That matters for childhood lead exposure because the policy choice is not necessarily binary. The alternatives are not simply to blood-test every child in the UK or to retain the existing passive system unchanged. A future review can also consider whether systematic testing should be targeted towards populations with a substantially higher probability of exposure.
The current review position
The 2018 recommendation is now being revisited.
In answer to a House of Lords written question tabled on 4 March 2026 and answered on 24 March 2026, the Department of Health and Social Care confirmed that the UK NSC recommended against screening in 2018, that a new proposal was submitted in 2024, and that the UK NSC is planning an evidence map as the first stage of the evidence-review process [13].
The current position is therefore more precise than simply saying that the UK has decided against childhood lead screening. Population screening is not currently recommended, on the basis of the last completed UK NSC review in 2018. But that recommendation is now entering a new evidence-review process.
The new review will take place in a materially different context. England now intervenes at half the blood lead concentration used when the previous review was completed. LEICSS is detecting substantially more children. Targeted screening now falls explicitly within the UK NSC’s remit. New approaches to sampling are being investigated. And the absence of contemporary representative UK prevalence data remains unresolved.
That last point is particularly important. Screening and prevalence measurement are related, but they are not the same thing. The UK does not necessarily need to establish a clinical screening programme for every child in order to determine how common elevated blood lead concentrations are.
A different public-health instrument can answer that question: representative population biomonitoring.
8. Population Biomonitoring and the International Evidence
The absence of routine childhood lead screening does not, by itself, explain why the UK lacks a contemporary estimate of childhood blood lead prevalence. Clinical screening and population biomonitoring are different public-health activities, designed to answer different questions.
Screening is primarily concerned with individuals. A screening programme systematically offers a test to people who do not necessarily have symptoms, with the objective of identifying those who may benefit from further investigation or intervention.
Population biomonitoring asks a different question: what is the distribution of blood lead concentrations across the population?
It does not require every child to be tested. Instead, biological samples are obtained from a carefully selected sample of the population. If the sampling design is representative and sufficiently large, the results can be weighted to estimate the distribution of blood lead concentrations in the wider population, including the geometric mean, median, upper percentiles and the proportion exceeding specified concentrations.
The distinction is important because the central question of this article — how many UK children have elevated levels of lead in their blood? — is fundamentally a prevalence question. It does not necessarily require a universal childhood screening programme to answer it.
The difference can be illustrated by comparing population biomonitoring with LEICSS. LEICSS begins with an individual child who is tested because lead exposure has been considered clinically or environmentally. The resulting population is therefore selected: children are included because something caused a blood lead test to be performed. A representative biomonitoring study works in the opposite direction. Participants are selected because they represent the population, not because lead exposure is already suspected.
This removes much of the ascertainment problem inherent in passive surveillance. Children with no symptoms, no recognised environmental exposure and no reason for a clinician to suspect lead can still be represented in the sample.
The principle is well established internationally. The World Health Organization identifies cross-sectional human biomonitoring programmes including the United States’ National Health and Nutrition Examination Survey, Canada’s Canadian Health Measures Survey and Germany’s German Environmental Survey as mechanisms for measuring exposure to environmental chemicals in populations [14].
United States
NHANES demonstrates how this can work at national scale. It uses a complex, multistage probability sample designed to represent the civilian, non-institutionalised US population. Participants undergo physical examinations and laboratory testing, including measurement of lead in blood. The results are weighted so that measurements obtained from the survey sample can be used to estimate the blood lead distribution of the wider population.
This is fundamentally different from counting children identified through clinical lead-testing programmes.
NHANES has allowed the United States to quantify the decline in childhood blood lead exposure over several decades and, importantly, to continue measuring the lower end of the distribution as population exposure has fallen. Analysis of the 2007–2010 NHANES data estimated that 2.6% of US children aged 1–5 years had blood lead concentrations ≥5 µg/dL, corresponding at the time to approximately 535,000 children [15]. More recent NHANES data have produced lower estimates. It is one of these later estimates — approximately 1.1% of children aged 1–5 years ≥5 µg/dL — that UKHSA used to illustrate what the number might look like if a similar prevalence applied to children in England.
NHANES has another important function. The US Centers for Disease Control and Prevention’s blood lead reference value is derived from the measured population distribution, identifying children whose concentrations are at or above the 97.5th percentile among US children aged 1–5, rather than treating the reference value as a toxicological threshold. In 2021 the CDC lowered that reference value from 5 µg/dL to 3.5 µg/dL.
Population biomonitoring therefore does more than produce a prevalence estimate. It provides an empirical distribution against which individual results and changes in population exposure can be assessed.
France
France provides a particularly relevant comparison because it has used population prevalence studies alongside risk-based clinical screening and surveillance.
The principal national childhood study, Saturn-Inf, was conducted in 2008–09 among children aged six months to six years. It enrolled 3,831 children recruited through 143 hospital paediatric departments in mainland France and the overseas regions, using a two-stage probability design in which the primary sampling units were hospitals and the second stage was hospitalised children, with stratification by hospital and French region. Sociodemographic characteristics were recorded, blood samples taken and environmental data collected by questionnaire, and statistical weighting was then used to estimate population exposure.
The survey found a geometric mean blood lead concentration of 14.9 µg/L, equivalent to 1.49 µg/dL, with a 95% confidence interval of 14.5 to 15.4. It estimated that 0.09% of children (95% CI 0.03–0.15) exceeded 100 µg/L, the then-applicable 10 µg/dL intervention concentration, and that 1.5% (95% CI 0.9–2.1) exceeded 50 µg/L, equivalent to 5 µg/dL [16]. The comparable prevalence above 100 µg/L had been approximately 2.1% in 1995–96, allowing France to quantify the substantial decline over the intervening period.
The value of Saturn-Inf was not confined to calculating a national average. Because environmental and sociodemographic information was collected alongside blood measurements, the study could examine factors associated with higher concentrations. Those findings are discussed in Section 11.
France separately maintains clinical surveillance. Blood lead testing is recommended when risk factors are identified, and cases can enter mandatory reporting and surveillance systems. The population study and the clinical system perform different functions: one estimates the distribution of exposure; the other identifies and manages individual children.
That distinction is directly relevant to England, where LEICSS performs the second function without an equivalent contemporary national prevalence survey performing the first.
Canada
Canada obtains population blood lead data through the Canadian Health Measures Survey, a recurring national health survey that combines questionnaires, physical measurements and biological sampling. Its sampling design covers approximately 96–97% of the Canadian population, with successive collection cycles providing repeated measurements over time.
Blood lead is measured directly in whole blood, allowing Health Canada and Statistics Canada to calculate nationally representative distributions rather than relying solely on clinically requested testing. The first cycle in 2007–09 included participants aged six years and over; among 910 children aged 6–11, the geometric mean was 0.90 µg/dL and the 95th percentile 1.95 µg/dL.[17]
At that stage Canada faced a limitation similar to the present UK problem for younger children: there were no national Canadian data for children under six, so US NHANES measurements were used as a surrogate when assessing that age group. Canada subsequently extended sampling to children aged 3–5 years, reducing its dependence on imported prevalence data.
That is an instructive comparison with the UK. International extrapolation can be useful when domestic measurements are missing, but it need not become a permanent substitute for them. Canada has also continued biomonitoring over successive survey cycles, allowing lead exposure to be considered as a distribution that changes over time rather than simply as a count of diagnosed cases.
Germany
Germany measures environmental chemical exposure through the German Environmental Survey. Unlike a clinical lead-surveillance programme, GerES is explicitly designed as population-representative environmental health monitoring.
The fifth survey, GerES V, was conducted between 2014 and 2017 and included 2,294 children and adolescents aged 3–17 years from 167 municipalities, with blood lead measured in 720 participants.[18] Biological monitoring covered a wide range of environmental substances in blood and urine, while environmental measurements and questionnaires were used to investigate potential sources and determinants of exposure. The data have since been used to investigate associations between children’s blood lead concentrations and environmental and dietary factors, including domestic tap-water exposure.
GerES is particularly useful conceptually because it treats lead as one component of a broader human biomonitoring system, rather than requiring a stand-alone national clinical screening programme for each environmental contaminant.
What the international evidence shows
These countries do not use identical systems. Nor should their measured prevalence estimates simply be transferred to UK children. Housing, industrial history, lead plumbing, environmental regulation, diet, socioeconomic conditions and population characteristics differ between countries.
Their importance to the UK lies elsewhere. They demonstrate that there is no necessary choice between universal clinical screening and not knowing the population distribution at all.
These systems allow questions to be answered that LEICSS cannot answer. What is the average childhood blood lead concentration? What does the distribution look like? What proportion of children exceed 5 µg/dL? How has that proportion changed over time? Are particular socioeconomic, demographic or environmental groups disproportionately exposed? Are population concentrations continuing to decline?
England can answer none of those questions with comparable contemporary representative data.
This also resolves some of the apparent tension surrounding the UK screening debate. It is possible to conclude that the evidence does not justify universal clinical screening of every child while simultaneously concluding that the country needs better representative biomonitoring to determine the prevalence and distribution of childhood lead exposure. Indeed, population biomonitoring can provide some of the evidence needed to decide whether screening is justified in the first place.
The UK currently relies on passive surveillance, historical domestic studies, international comparisons and statistical modelling to infer the scale of childhood lead exposure. Other high-income countries have shown that representative blood lead distributions can instead be measured directly from appropriately designed population samples.
That difference explains why the UK can estimate how many children might have elevated blood lead concentrations, but still cannot say with confidence how many actually do.
9. Estimates of Childhood Lead Exposure in the UK
If LEICSS cannot measure population prevalence, the obvious question is whether other evidence can tell us how many UK children have blood lead concentrations at or above 5 µg/dL.
Several numbers are available, but they differ substantially.
| Measure | Geography | Age | Reference period | Number ≥5 µg/dL | What the number represents |
|---|---|---|---|---|---|
| LEICSS | England | 0–15 | 2024 | 247 | Newly detected and reported surveillance cases |
| UKHSA international extrapolation | England | 1–5 | 2024 population | ~34,541 | Illustrative application of US prevalence to the English population |
| IHME/UNICEF | UK | 0–19 | 2019 | 213,702 | Modelled population estimate |
At first sight, these figures appear irreconcilable. They are not. They are estimates or observations of different epidemiological quantities, in different populations, produced by different methods. The three figures cannot be placed on a single scale and treated as alternative measurements of the same population.
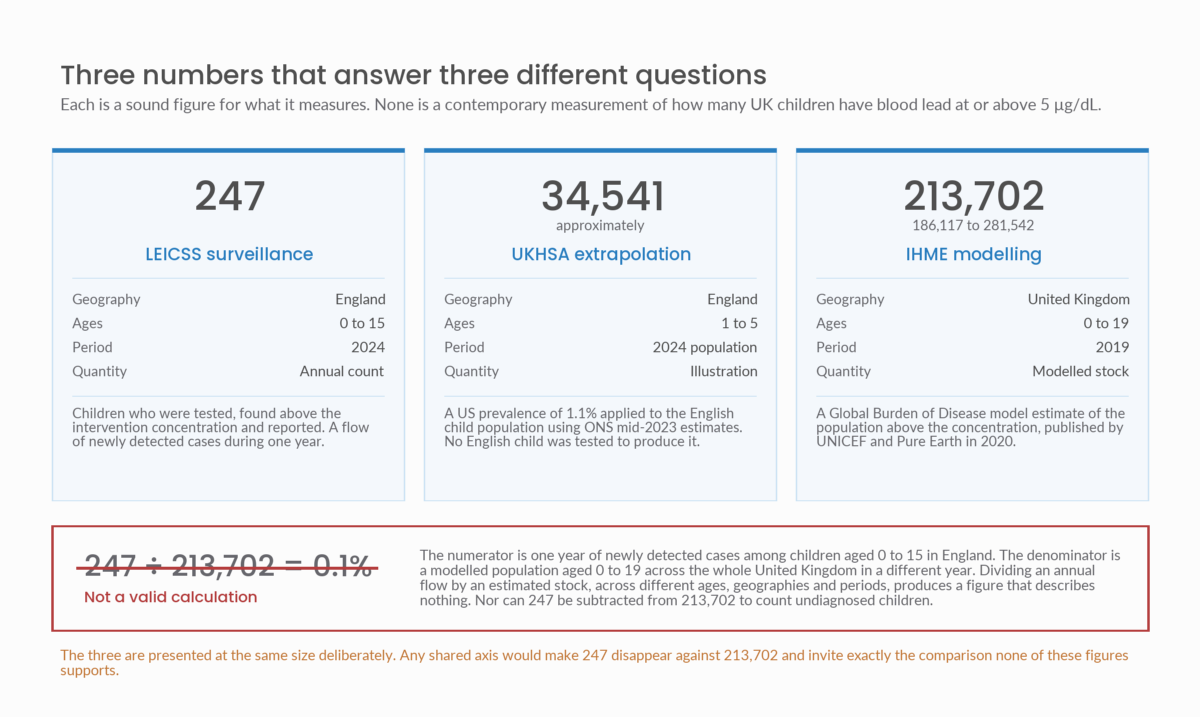
Figure 4. Each figure is sound for what it measures. None is a contemporary measurement of how many UK children have blood lead at or above 5 µg/dL. They are presented at the same size deliberately: any shared axis would make 247 vanish against 213,702 and invite the division that none of them supports.
LEICSS: 247 children detected
The most concrete number is the smallest. In 2024, 247 children aged under 16 in England met the LEICSS case definition. The national detection rate was 23 cases per million children. Of the 247 cases, 223 were reported directly through participating laboratories and 24 through other routes.
These are real, identified children with blood lead concentrations at or above the intervention concentration. But the figure of 247 answers a narrow question: how many qualifying children were detected and reported to LEICSS during 2024?
It does not answer: how many children in England had a blood lead concentration ≥5 µg/dL during 2024?
UKHSA makes this distinction explicitly. Its report states that surveillance of clinically reported cases is likely to underestimate the number of affected children because lower blood lead concentrations often produce no overt clinical symptoms. It also states directly that there are no data available regarding the number of children in England exposed to lead above this threshold.
The LEICSS figure should therefore be regarded as an annual flow of newly detected cases, not a population prevalence estimate.
UKHSA: approximately 34,541 children
Because England lacks contemporary representative prevalence data, UKHSA has examined surveys from comparable high-income countries to illustrate the possible scale of childhood exposure.
Its 2025 report cites a US estimate that 1.1% of children aged 1–5 years had blood lead concentrations ≥5 µg/dL. Applying that proportion to the corresponding population of children in England, using ONS mid-2023 population estimates, produced an estimate of approximately 34,541 children above the intervention concentration.
This number is very different from 247, but it is also a fundamentally different type of number. Those 34,541 children have not been identified through blood testing in England. UKHSA has taken a prevalence measured in another country and applied it to the English population as an illustration of what the underlying number might look like if English children had a similar prevalence. UKHSA itself qualifies the calculation by noting that population differences must be considered when using international survey data in this way.
There is a useful demonstration of this uncertainty in UKHSA’s own successive reports. The report published in 2024 used an earlier US estimate of 2.6% and applied it to English children aged 1–4, producing an estimate of approximately 64,780 children above 5 µg/dL.[19] The following year’s report used the more recent US estimate of 1.1% among children aged 1–5 and produced approximately 34,541.
The English population did not suddenly halve its childhood lead prevalence between those publications. The comparator changed.
That illustrates both the usefulness and the limitation of international extrapolation. It can demonstrate that the number expected from population studies may be substantially greater than the number detected through passive surveillance. It cannot substitute for measuring the English population itself.
IHME and UNICEF: 213,702
The largest and most frequently cited UK estimate comes from IHME modelling associated with the Global Burden of Disease 2019 study and published in UNICEF and Pure Earth’s The Toxic Truth [20].
For the United Kingdom, the model estimated that in 2019, 213,702 children and young people aged 0–19 had blood lead concentrations ≥5 µg/dL, with an uncertainty interval of 186,117 to 281,542 [21]. At the former 10 µg/dL intervention concentration, the corresponding estimate was 29,036, with an uncertainty interval of 25,099 to 42,470.
The difference between those two estimates is important. Within the IHME model, lowering the concentration of interest from 10 to 5 µg/dL increases the estimated population above it by more than sevenfold. It reinforces why the lower end of the blood lead distribution matters when considering the number of children potentially affected.
But 213,702 is not a count of British children who received blood tests. The UNICEF and Pure Earth report states that its country-level blood lead calculations were supplied by IHME using GBD 2019 modelling. The estimate therefore depends on the empirical data available to the model and statistical estimation where direct country data are incomplete. This is particularly important in the UK because, as already established, contemporary nationally representative childhood blood lead measurements are absent.
The uncertainty interval also makes clear that 213,702 should not be interpreted as a precise headcount.
Why 247 cannot be compared directly with 213,702
The temptation is obvious. If IHME estimated 213,702 UK children above 5 µg/dL and LEICSS identified 247 cases in 2024, it might appear possible to divide one by the other and estimate what proportion of affected children the surveillance system detects.
That calculation would be epidemiologically invalid.
The numerator and denominator do not describe the same population. 247 is one year’s flow of newly detected cases among children aged 0–15 in England. 213,702 is a modelled estimate of the population aged 0–19 above a specified blood lead concentration across the United Kingdom in 2019. One is an annual surveillance count; the other is an estimated population stock. The age ranges, geography, time periods and methods all differ.
It would therefore be incorrect to say that LEICSS detects approximately 0.1% of lead-exposed children. Nor can 247 be subtracted from 213,702 to produce a figure for the number of “undiagnosed” children.
The same problem applies to the UKHSA extrapolation of 34,541. It concerns children aged 1–5 in England and is derived by transferring a US prevalence estimate to the English population. It is not a measured pool of children from which the year’s 247 LEICSS cases can simply be deducted.
What the estimates do tell us
The estimates nevertheless contain useful information when their limitations are respected.
LEICSS establishes that children with blood lead concentrations ≥5 µg/dL continue to be detected in England and that the number being identified has risen substantially.
International population surveys demonstrate that representative sampling generally finds elevated blood lead at a prevalence far greater than would be inferred from clinically detected cases alone. UKHSA itself concludes from these surveys that the number reported through LEICSS is significantly lower than the likely number of affected children in England.
The IHME model goes further by attempting to estimate the UK population burden despite the absence of contemporary representative national measurements. Its estimate suggests a potentially substantial population above 5 µg/dL, but its precision is constrained by exactly the evidence gap this article is examining.
The three figures should therefore be read together, but not equated. 247 tells us how many children England found in one year. 34,541 illustrates what the number might look like among young English children if a recent US prevalence applied here. 213,702 is a modelled estimate of the number of UK 0–19-year-olds above 5 µg/dL in 2019.
None is a contemporary, directly measured estimate of the prevalence of elevated blood lead across UK children.
That is why the apparently straightforward question in the title remains unresolved. The UK has observed cases, international extrapolations and modelled estimates. What it does not have is a contemporary representative measurement of its own child population.
10. ECLIPS
The absence of contemporary representative childhood blood lead data in the UK has now prompted an attempt to develop a different way of measuring exposure. The Elevated Childhood Lead Interagency Prevalence Study was developed through UKHSA’s Lead Exposure, Public Health Intervention and Surveillance group and is being conducted through a collaboration involving Northumbria University, UKHSA, Leeds Teaching Hospitals NHS Trust and other partners, with funding from UK Research and Innovation.
ECLIPS is important because it starts from a different position from LEICSS. Rather than waiting for clinical suspicion to produce a blood lead test, the study is inviting families with young children to participate directly. Its purpose is both to investigate childhood lead exposure and to test whether a less invasive method of collecting blood samples could provide a practical basis for much larger population studies.
The main study launched in Leeds in November 2025. Approximately 150,000 households were sent invitations, with an initial aim of recruiting 500 children aged 1–6 years. Participating families collect samples at home rather than bringing the child into a clinic for conventional venous blood sampling.
Home blood sampling
At the centre of ECLIPS is a finger-prick blood sampling method.
Conventional investigation of childhood lead exposure generally requires a venous blood sample obtained in a clinical setting. That is practical when a clinician already has reason to investigate an individual child, but it presents a greater obstacle when attempting to recruit large numbers of otherwise healthy young children into a population study.
ECLIPS is testing whether this barrier can be reduced. Parents use a home sampling kit to obtain an accurately measured blood spot from a finger prick, using an approach described by the investigators as similar to finger-prick glucose testing. The sample can then be returned for laboratory analysis without the child attending a clinic or requiring a healthcare professional to perform the initial collection.
This methodological question is important in its own right. As discussed in the section on screening, one of the practical problems considered by the UK NSC in 2018 was how blood lead testing could be performed acceptably and reliably in large numbers of young children, including the contamination risks associated with capillary sampling. ECLIPS is therefore investigating one of the practical constraints that has historically complicated both screening and population biomonitoring.
Blood, dust, soil and the home environment
ECLIPS is not limited to measuring blood lead. Participating households also provide house dust and soil samples and complete a questionnaire about potential sources of exposure.
This gives the study a second purpose. A blood lead concentration establishes that lead has entered the body, but does not by itself identify where the exposure originated. Environmental sampling and household information can help investigate the circumstances associated with higher concentrations.
That is particularly relevant in England because several potential sources may coexist within the same property or household. LEICSS investigations have identified paint, contaminated soil and dust, drinking-water pipes, occupational take-home exposure, imported ceramics and utensils, food and spices, and traditional medicines among potential exposure routes. Older housing may contain several of these hazards simultaneously.
The combination of biological and environmental measurements therefore offers something that surveillance data alone cannot provide: the possibility of examining blood lead concentrations alongside characteristics of the child’s immediate environment. It is, in effect, the design that produced the French Plomb-Habitat findings discussed in Section 11, applied to one English city.
Why Leeds?
Leeds was not selected because UKHSA had established that children there have the highest underlying prevalence of elevated blood lead in England.
It was selected in the context of the unusually high case-detection rate observed in Yorkshire and the Humber. UKHSA recorded 93–94 detected cases per million children in the region in 2024, compared with 23 per million nationally. But, as discussed earlier, UKHSA considers much of this difference likely to reflect increased clinical awareness and testing rather than evidence that underlying prevalence is necessarily several times higher.
The Leeds Supra-regional Assay Service laboratory has actively encouraged clinicians to test children for lead exposure in particular clinical circumstances, including iron deficiency combined with pica, and UKHSA reports that this contributed to an approximately 90% increase in testing and case reporting.
Leeds therefore provides an established clinical and laboratory environment in which childhood lead exposure is already being actively considered. But that feature is also relevant when considering how far the eventual ECLIPS results can be generalised.
What ECLIPS may establish
ECLIPS may answer several questions that LEICSS cannot.
Most importantly, it can test whether children can be recruited and blood lead measured through a household-based sampling programme that does not depend upon prior clinical suspicion. If participation and sample quality are sufficient, this could provide a practical method for conducting much larger prevalence studies.
The study may also provide empirical information on the distribution of blood lead concentrations among participating young children in Leeds, including children who would never otherwise have received a clinical blood lead test. Environmental sampling may help identify associations between blood lead concentrations and household exposures. And the study can establish the practical performance of the recruitment, sampling, laboratory and follow-up pathway needed for a larger programme.
UKHSA has been explicit about the longer-term objective. At the study’s launch, it stated that although ECLIPS is being conducted in one area, the project will help establish whether the approach could be used more widely to determine prevalence across the UK.[22]
In that respect, ECLIPS is as much a study of how Britain might measure childhood lead exposure as it is a study of lead exposure in Leeds.
What ECLIPS cannot yet establish
ECLIPS does not, however, solve the UK’s national prevalence problem simply by testing children outside the clinical surveillance system.
The initial target is approximately 500 children aged 1–6 in one city. That is very different from a probability sample explicitly designed to represent all UK children.
Participation is also voluntary. Invitations to 150,000 households do not mean that 150,000 children will be tested, and the characteristics of families who choose to participate may differ from those who do not. The extent to which any resulting prevalence estimate represents the wider Leeds child population will therefore depend on the study’s recruitment, response, sampling and analytical methodology.
More importantly, Leeds is not the United Kingdom. The distribution of potential lead sources varies geographically. Housing age and type, legacy industrial contamination, lead plumbing, socioeconomic circumstances and population characteristics differ between Leeds and other parts of England, and between England, Scotland, Wales and Northern Ireland. Existing English surveillance research has already identified housing age and terraced housing as characteristics associated with elevated blood lead among reported cases. The distribution of lead-era housing across London is examined in our analysis of older housing and legacy lead water pipes [23].
A prevalence measured among participating Leeds children therefore cannot simply be multiplied by the number of children in the UK and presented as a national estimate.
ECLIPS should consequently be understood primarily as a feasibility and methodological step towards better prevalence measurement, rather than as the national prevalence survey that the UK currently lacks. Earlier UKHSA reporting described the project specifically as a feasibility study focused on protocol development and testing of the finger-prick method. As of the sources reviewed here, no ECLIPS childhood prevalence result has yet been published.
Its significance lies instead in what happens if the method works. A practical home microsampling system could make it considerably easier to recruit children into a larger geographically representative biomonitoring study. Such a study could then be designed around population sampling rather than clinical suspicion and could include sufficient numbers of children to estimate prevalence by age and potentially by other characteristics.
That would represent a fundamental change in the UK’s evidence base.
LEICSS tells us about children who are found. ECLIPS is testing whether Britain can develop a practical way of measuring children who would not otherwise have been looked for.
11. Sources of Lead Exposure
Identifying a child with an elevated blood lead concentration is only the beginning of a public-health investigation. The concentration establishes that lead has entered the child’s body; it does not identify where the lead came from. A child may encounter lead from several environmental and household sources, and more than one source may be present at the same time.
This distinction is particularly important when interpreting LEICSS. The surveillance system records confirmed elevated blood lead concentrations, while its Enhanced Surveillance Questionnaire gathers information about possible sources and circumstances of exposure. These data provide valuable evidence about the environments in which identified cases occur, but they are not a population source-apportionment study.
In 2024, UKHSA received completed questionnaires for 101 cases whose investigations had concluded. Among these, the most frequently recorded potential exposures were soil (24%), paint (17%), drinking water and/or lead pipes (12%), and parental or guardian occupational exposure (6%). Other potential sources included imported utensils, ceramics and pewter (4%), imported spices and food (2%) and traditional medicines (1%). Individual children could have more than one potential exposure recorded.
Those percentages need to be interpreted carefully, and four qualifications apply.
First, they do not mean that 24% of childhood lead exposure in England is caused by soil, 17% by paint or 12% by drinking water and lead pipes. The data concern a selected subset of children already identified with elevated blood lead, and the categories describe potential exposures identified during investigation.
Second, only 101 of the 247 confirmed cases in 2024 had concluded questionnaires included in this analysis, and case management requires a questionnaire only where blood lead is at or above 10 µg/dL. That subset is therefore weighted towards the more heavily exposed cases rather than drawn at random.
Third, exposures can overlap, so the figures do not sum to 100.
Fourth, and most important for interpreting change over time, the comparison between years is unstable. UKHSA reports that drinking water and lead pipes doubled from 6% to 12%. Its narrative describes the 6% as the previous year, but the table it draws on gives 6% as the pooled figure across the 236 questionnaires completed between 2021 and 2023. Across that same comparison, soil fell from 67% to 24% and paint from 44% to 17%. Falls of that magnitude in a single step are unlikely to describe a real change in where children are encountering lead, and are more likely to reflect a change in how questionnaires were completed or coded. Workplace exposure also rose, from 3% to 6%. The apparent rise in drinking water sits inside that same shift and should be read with the same caution.
Paint, dust and soil
Lead-based paint remains an important potential source in older housing. Although its use was progressively restricted from the 1960s and eventually banned from sale in 1992, lead paint may remain beneath later decorative layers. When intact and undisturbed it presents a different exposure potential from paint that is deteriorating, flaking, sanded or disturbed during renovation.
For young children, the pathway is frequently indirect. Lead-containing paint and other materials contribute lead to household dust, which can settle on floors, toys and other surfaces. Normal hand-to-mouth behaviour then provides a route of ingestion. Pica can substantially increase exposure where a child deliberately ingests paint flakes, soil or other non-food materials.
Soil can contain lead from several historical sources, including former industrial activity, deposition from leaded petrol, exterior paint and other urban contamination. Again, the presence of lead in soil does not by itself establish that it caused an individual child’s elevated blood lead. Exposure depends on concentration, accessibility, behaviour and the extent to which contaminated soil or dust is ingested.
Occupational take-home exposure
Lead used or disturbed in the workplace can also reach children indirectly. Workers in occupations involving lead may carry contaminated dust home on clothing, footwear, tools, vehicles or personal belongings. A child may therefore be exposed without ever entering the workplace itself.
Potentially relevant activities can include metalworking, construction and renovation, demolition, recycling and waste processing, work involving batteries, shooting and other activities where lead-containing materials or dust are encountered.
The presence of an occupational exposure in the household is again a potential pathway, not automatic proof of causation.
Imported products, food and ceramics
Some sources of childhood exposure are not fixed features of the UK built environment. UKHSA investigations recognise a range of consumer and household products as potential sources, including imported ceramics and cookware, traditional medicines and cosmetics, and some foods or spices. Lead-containing glazes or pigments can contaminate food, while lead may also be introduced into spices and other products during production, processing or through adulteration.
These pathways are important because they are easily missed if an investigation focuses only on the child’s home or on conventional UK environmental sources.
Drinking water and lead pipes
Drinking water represents a different type of potential exposure because lead is not normally present in significant quantities in water when it leaves the treatment works. Where lead occurs at the tap, it is principally associated with contact between water and lead-containing plumbing materials.
In the UK, this is particularly relevant to older properties. Lead communication pipes, private supply pipes and internal lead plumbing may remain in service, while lead can also be released from some fittings, solder and other plumbing components. PHE’s 2021 review summarises the regulatory position as follows: the use of lead water pipes was phased out by the end of the 1960s and the use of lead solders by the late 1980s, and under the Water Supply (Water Fittings) Regulations 1999 lead pipe, fittings and solder are prohibited for use in new installations. The same review records a regulatory limit of 10 µg/L for lead in drinking water under the Water Supply (Water Quality) Regulations 2016 and the Private Water Supplies (England) Regulations 2016.
Lead can dissolve into water during contact with lead-containing materials, and particulate lead may also be released from corrosion scales or disturbed deposits. The resulting concentration at the tap is not fixed. It can vary with water chemistry, the length and configuration of lead pipework, stagnation time, previous water use, flow conditions and particulate mobilisation.
This makes source attribution particularly demanding. The presence of a lead pipe establishes a potential source; it does not establish how much that source contributed to a child’s blood lead concentration. Conversely, a single low water sample does not necessarily exclude drinking water as a contributor, because the concentration measured depends upon the sampling conditions and the section of plumbing represented by the sample. What a single result can and cannot establish is set out in our review of sampling protocols and what a lead result actually means.
There is, however, one place where the contribution of drinking water has been measured rather than inferred. France’s national biomonitoring survey, Saturn-Inf, was accompanied by a nested environmental study, Plomb-Habitat, which visited the homes of 484 of the participating children and measured lead in tap water, soils, household settled dusts, paints, traditional cosmetics and craft ceramics.[24] Because blood and environmental measurements were collected from the same children, the study could identify which household characteristics were associated with higher blood lead across the population rather than only among children already suspected of exposure.
The environmental factors significantly associated with blood lead concentration were the consumption of tap water in homes with lead service connections, peeling paint or recent renovation in old housing, hand-to-mouth behaviour, passive smoking, and having a mother born in a country where lead is often used [16].
Tap water drawn through a lead service connection therefore appears in that list alongside deteriorating paint, and it does so in a study designed to represent a national child population rather than a set of investigated cases. That is a stronger form of evidence about drinking water’s contribution than English surveillance can currently produce, because England has no equivalent study. It is also evidence about French housing, French water chemistry and French plumbing, and should not be read as a quantification of the contribution in the United Kingdom.
The category recorded in English surveillance — “drinking water and/or lead pipes” — also does not establish that elevated lead was analytically demonstrated in the household’s drinking water in every case. Potential exposure, environmental confirmation and causal attribution are different evidential stages.
Multiple sources
Attempting to assign every elevated blood lead concentration to one source can itself be misleading.
A child living in an older urban property might simultaneously encounter legacy paint, contaminated household dust, lead in garden soil and lead plumbing. Another child might have both an environmental source at home and exposure associated with a parent’s occupation. Imported products may add another pathway.
Blood lead concentration integrates lead absorbed from these sources. It does not carry a signature identifying the proportion contributed by each one.
This is why environmental investigation is central to case management. The practical objective is not necessarily to prove that one source accounts for the entirety of a child’s blood lead before action can be taken. It is to identify credible continuing sources and reduce or eliminate exposure wherever reasonably possible.
The distinction also matters at population level. LEICSS can show which potential exposures repeatedly arise among detected cases, but it cannot establish what proportion of blood lead across the entire UK child population comes from paint, soil, drinking water, imported products or any other source.
Answering that larger question would require a different study design: representative biological measurements combined with systematically collected environmental, housing, behavioural and socioeconomic information. France has done it. England has not.
For the present, the evidence supports a narrower conclusion. Childhood lead exposure in the UK is not a single-source problem. The children identified through surveillance may encounter lead in the fabric of older housing, soil and dust, household products, food and ceramics, occupationally transported contamination and drinking water supplied through legacy lead plumbing.
12. The UK Evidence Gap
The evidence assembled across the preceding sections leads to a clear conclusion. The United Kingdom has become better at defining, detecting and investigating childhood lead exposure, but it still lacks the population measurement required to determine how many children are actually affected.
England lowered its public-health intervention concentration from 10 µg/dL to 5 µg/dL in 2021 because the evidence showed adverse effects below the old level and did not support a threshold below which harm could be excluded. That policy change brought a much larger group of children within formal public-health surveillance and case management.
LEICSS subsequently began identifying substantially more cases. In the first three complete years under the lower definition, 664 children met the surveillance case definition, of whom 416 — 62.7% — had blood lead concentrations between 5 and <10 µg/dL. Those children would not have met the previous ≥10 µg/dL surveillance definition. At the same time, the number of children detected at ≥10 µg/dL also increased, showing that the rise in case numbers cannot be explained by the threshold change alone.
Improved ascertainment is part of the explanation. The Leeds experience demonstrates that when clinicians are prompted to consider lead exposure and request more blood tests, more cases are found. Regional detection rates therefore reflect not only underlying exposure but also variation in clinical recognition, testing and reporting.
That is precisely why LEICSS cannot provide the denominator required to estimate national prevalence.
A child can only enter LEICSS after a chain of events has occurred: exposure must exist, the possibility of lead must be recognised, a test must be requested, a sample must be obtained, an elevated result must be identified and the case must reach surveillance. Children can be lost from that pathway at every stage. Low-level exposure may be asymptomatic, risk factors may not be recognised, and testing practices vary.
LEICSS therefore measures annual case detection, not population prevalence.
The same limitation applies to clinically requested blood lead testing in Wales. These data are useful for surveillance and case management, but children who are tested are not a representative sample of the child population. No contemporary nationally representative childhood biomonitoring programme was identified in Scotland or Northern Ireland either.
The UK consequently relies on three imperfect forms of evidence.
The first is historical domestic measurement. Blood lead concentrations in UK children clearly declined during the late twentieth century, but the last representative English population data date from the 1990s.
The second is international extrapolation. UKHSA has applied prevalence estimates from the United States to English children to illustrate the possible scale of exposure, generating figures of approximately 34,541 in its latest analysis and around 64,780 in the previous year’s. The large difference between those estimates reflects changes in the external comparator and age group rather than direct changes measured in England.
The third is statistical modelling. IHME estimated that 213,702 UK children and young people aged 0–19 had blood lead concentrations ≥5 µg/dL in 2019, with an uncertainty interval of 186,117 to 281,542. That figure is useful as a model-based indication of possible population burden, but it is not a direct measurement of contemporary UK childhood prevalence.
These approaches are not interchangeable. LEICSS counts children who were found. International extrapolation estimates what England might look like if another country’s prevalence applied. IHME models the likely population burden. None provides a contemporary representative measurement of the UK child population.
This is the denominator problem at the centre of the subject.
Without a representative sample, the UK cannot determine with confidence:
- the proportion of children with blood lead concentrations ≥5 µg/dL;
- the proportion above other concentrations such as 3.5 or 10 µg/dL;
- how exposure varies by age;
- how strongly it is patterned by deprivation, housing age, geography or ethnicity;
- whether average and upper-tail concentrations are continuing to fall;
- or how much of the national burden is associated with particular sources such as paint, soil, imported products or legacy lead plumbing.
The country can describe detected cases in increasing detail, but it cannot yet describe the population distribution from which those cases arise.
That distinction also matters for policy.
The current debate should not be reduced to whether every child should be universally screened. Population screening, targeted testing and representative biomonitoring are different tools. A nationally representative biomonitoring study could establish the prevalence and distribution of childhood blood lead without requiring routine clinical testing of every child. Those data could then inform the separate question of whether universal, targeted or risk-stratified screening would provide sufficient benefit.
ECLIPS is important because it begins to address the methodological problem. Its use of household recruitment, finger-prick microsampling and environmental sampling may establish whether large-scale prevalence measurement can be made practical. But the initial study is based in Leeds and is not, by itself, a UK-wide probability sample. As of the evidence reviewed here, it cannot yet provide the national denominator.
The same is true of the renewed UK National Screening Committee review. The fact that screening policy is being reconsidered is significant, but the review process itself does not resolve the prevalence gap. One of the central uncertainties identified in 2018 — how common elevated blood lead is among UK children — remains unresolved nationally in 2026.
The UK therefore sits in an unusual position. It has lowered the concentration at which public-health intervention begins. It has improved surveillance. It is detecting more children. It is collecting better information about potential sources. It has begun testing new methods for prevalence research.
But it still does not know, from direct representative measurement, how many UK children have elevated levels of lead in their blood.
That missing denominator is not a minor technical limitation. It determines how confidently the scale of the problem can be described, how effectively resources can be targeted, and how future screening and prevention policy can be evaluated.
13. Conclusion
So, how many UK children have elevated levels of lead in their blood?
The most accurate answer is that we do not currently know.
We know how many children are being identified through surveillance in England. In 2024, LEICSS recorded 247 confirmed cases with blood lead concentrations at or above the 5 µg/dL public-health intervention concentration. We also know that case detection has increased substantially since England lowered that concentration from 10 to 5 µg/dL in July 2021.
The change has had a measurable effect. During the first three complete years under the lower intervention concentration, 664 children were identified through LEICSS. Of these, 416 had blood lead concentrations between 5 and <10 µg/dL. They represented almost two-thirds of confirmed cases and would not have met the former ≥10 µg/dL surveillance definition.
Lowering the intervention concentration has therefore brought a substantial group of children within public-health surveillance who previously fell below the level at which formal intervention was triggered.
But it has also exposed the limitations of the surveillance data.
The number of children detected at ≥10 µg/dL has risen as well. England identified 72 such children in 2022 and 88 in both 2023 and 2024, compared with an average of 38.5 total cases per year during 2015–20, when ≥10 µg/dL was the LEICSS case definition. The Leeds experience provides further evidence that increased clinical awareness and blood lead testing can substantially increase case detection.
LEICSS is therefore telling us something important, but it is not measuring prevalence. It records children whose elevated blood lead concentrations have been detected. Children who are not tested are not represented.
That distinction explains the enormous difference between the numbers encountered throughout this article. 247 children were detected through LEICSS in England in 2024. UKHSA has estimated that approximately 34,541 children aged 1–5 in England might have blood lead concentrations ≥5 µg/dL if a recent US prevalence estimate were applicable to the English population. IHME modelling estimated that 213,702 children and young people aged 0–19 across the UK had blood lead concentrations ≥5 µg/dL in 2019.
These figures should not be used to calculate how many children LEICSS is “missing”. They describe different populations, age groups, years and epidemiological quantities. But their disparity illustrates the central problem: England can count the children it finds, but the UK does not have the contemporary representative blood lead measurements required to count — or reliably estimate from its own empirical data — the population from which those cases arise.
That is not inevitable.
The United States, Canada, Germany and France demonstrate that representative population biomonitoring can establish childhood blood lead distributions without universally screening every child. A properly designed sample can estimate the proportion above 5 µg/dL, describe the lower and upper parts of the distribution, identify inequalities in exposure and determine whether concentrations are continuing to decline. France’s Plomb-Habitat study went further still, identifying tap water drawn through lead service connections among the household factors significantly associated with children’s blood lead — the kind of finding England cannot currently produce.
The UK does not have an equivalent contemporary national dataset.
ECLIPS may represent the beginning of a response to that evidence gap. Its work in Leeds is testing whether home finger-prick sampling and household recruitment can make larger-scale childhood blood lead measurement practical. But a study in one city cannot establish UK prevalence. A national answer would ultimately require representative measurement across a population sufficiently broad to capture geographical, demographic, socioeconomic and housing differences.
The renewed UK National Screening Committee review may also reconsider how children at elevated risk should be identified. But screening is a separate question from population measurement. The UK does not need to decide that every child should receive a blood lead test before it can establish how much lead is present in children’s blood at population level.
More than three decades after the last representative English childhood blood lead data, the fundamental evidence gap therefore remains.
We know that childhood blood lead concentrations fell dramatically during the late twentieth century. We know that lead exposure has not disappeared. We know that adverse effects occur at concentrations below the former 10 µg/dL intervention level. We know that lowering the intervention concentration to 5 µg/dL has brought hundreds of additional children within public-health surveillance. And we know that when clinicians test more children, more cases are found.
What we still do not know is how many UK children currently have blood lead concentrations at or above 5 µg/dL.
Until blood lead is measured in a contemporary representative sample of UK children, the answer will continue to depend on surveillance counts, international comparisons and statistical models rather than direct national measurement.
For a country that has already decided that 5 µg/dL warrants public-health intervention, that is a significant gap in the evidence.
References
- Public Health England. Evaluation of whether to lower the public health intervention concentration for lead exposure in children: a report by the lead intervention concentration working group. London: PHE; 2021. Gateway number GOV-7970.
- Quinn MJ, Delves HT. UK blood lead monitoring programme 1984–1987: protocol and results for 1984. Hum Toxicol. 1987;6(6):459–74.
- Quinn MJ, Delves HT. The UK blood lead monitoring programme 1984–1987: results for 1986. Hum Toxicol. 1989;8(3):205–20.
- Department of the Environment. UK blood lead monitoring programme 1984–1987: results for 1987. Pollution Report No. 28. London: HMSO; 1990.
- O’Donohoe J, Chalkley S, Richmond J, Barltrop D. Blood lead in U.K. children — time for a lower action level? Clin Sci. 1998;95(2):219–23.
- Chandramouli K, Steer CD, Ellis M, Emond AM. Effects of early childhood lead exposure on academic performance and behaviour of school age children. Arch Dis Child. 2009;94(11):844–8.
- UK Health Security Agency. Lead: environmental and public health intervention. London: UKHSA; 2025.
- UK Health Security Agency. Lead Exposure in Children Surveillance System (LEICSS) annual report, 2025. Health Protection Report 19(12). London: UKHSA; 2025. [Surveillance data for 2024.]
- UK Health Security Agency. Lead Exposure in Children Surveillance System (LEICSS) annual report, 2022. London: UKHSA; 2022. [Surveillance data for 2021.]
- UK Health Security Agency. Lead Exposure in Children Surveillance System (LEICSS) annual report, 2023. London: UKHSA; 2023. [Surveillance data for 2022.]
- Crabbe H, Alexander C, Klein JL, Verlander NQ, Iqbal N, Leonardi G, Busby A. Case epidemiology from the first three years of a pilot laboratory-based surveillance system for elevated blood-lead concentrations among children in England, 2014–17: implications for public health action. J Public Health. 2019.
- UK National Screening Committee. Screening for elevated blood lead levels in children aged 1 to 5 years: external review against programme appraisal criteria. London: UK NSC; 2018.
- Department of Health and Social Care. Lead: health hazards. House of Lords Written Question HL15152, tabled 4 March 2026, answered 24 March 2026 by Baroness Merron. London: UK Parliament; 2026.
- World Health Organization Regional Office for Europe. Human biomonitoring: assessment of exposure to chemicals and their health risks. Copenhagen: WHO Regional Office for Europe; 2023.
- Centers for Disease Control and Prevention. Blood lead levels in children aged 1–5 years — United States, 1999–2010. MMWR Morb Mortal Wkly Rep. 2013;62(13):245–8.
- Etchevers A, Bretin P, Lecoffre C, Bidondo M-L, Le Strat Y, Glorennec P, et al. Blood lead levels and risk factors in young children in France, 2008–2009. Int J Hyg Environ Health. 2014;217(4–5):528–37.
- Health Canada. Human biomonitoring of environmental chemicals in Canada: lead. Ottawa: Government of Canada; 2024.
- Kolossa-Gehring M, et al. German Environmental Survey for Children and Adolescents 2014–2017 (GerES V). Dessau-Roßlau: Umweltbundesamt; 2023.
- UK Health Security Agency. Lead Exposure in Children Surveillance System (LEICSS) annual report, 2024. Health Protection Report 18(10). London: UKHSA; 2024. [Surveillance data for 2023.]
- UNICEF, Pure Earth. The toxic truth: children’s exposure to lead pollution undermines a generation of future potential. 2nd ed. New York: UNICEF and Pure Earth; 2020.
- Institute for Health Metrics and Evaluation. Global Burden of Disease Study 2019: blood lead estimates. Seattle, WA: IHME; 2020. UK country estimates reproduced in UNICEF and Pure Earth (2020), Annex A.
- UK Health Security Agency. UK’s first citizen-led study on childhood lead exposure begins. London: UKHSA; 17 November 2025.
- Crabbe H, Verlander NQ, Iqbal N, Close R, White G, Leonardi GS, Busby A. As safe as houses: the risk of childhood lead exposure from housing in England and implications for public health. BMC Public Health. 2022;22:2052.
- Lucas J-P, Le Bot B, Glorennec P, Etchevers A, Bretin P, Douay F, et al. Lead contamination in French children’s homes and environment. Environ Res. 2012;116:58–65.
Disclosure
This article is published by London & Surrey Water Services Ltd, a CIPHE and WaterSafe approved contractor specialising in lead pipe replacement across Greater London and Surrey. The company has a commercial interest in the replacement of lead pipework. The article does not recommend any product or service, and the evidence and limitations described are those stated by the cited sources.