
Introduction
Most writing about lead concerns children, and the emphasis is well placed. The developing brain is the most vulnerable target and the neurodevelopmental evidence is the strongest in the field. But lead does not stop mattering when a person grows up, and the adult evidence has developed substantially over the past two decades.
Two outcomes now carry a serious literature: kidney function and cardiovascular risk. When the Drinking Water Inspectorate commissioned a cost-benefit analysis to inform long-term lead policy for England and Wales, both were monetised alongside childhood IQ, and avoided chronic kidney disease emerged as one of the two largest components of the total benefit, comparable in scale to the childhood cognitive benefit that dominates public discussion. [1]
This article sets out what that evidence actually shows, where it is strong, and where it remains genuinely unsettled.
Table of Contents
Why adults remain exposed
There are two reasons lead stays relevant into adulthood.
The first is stored exposure. A substantial proportion of the lead a person absorbs over a lifetime is deposited in bone, where it can persist for years and release slowly back into the bloodstream. An adult in Britain today carries a body burden accumulated partly during the leaded-petrol era, and that burden mobilises gradually over decades. Blood lead measures recent exposure; bone lead reflects cumulative dose. For chronic disease that develops slowly, the distinction matters, and several of the studies discussed below were designed around it.
The second is current exposure. Where a lead supply pipe remains in use, exposure is not historical. It is daily, it continues for as long as the pipe is in contact with drinking water, and it applies to every occupant of the property regardless of age.
UKHSA’s toxicological overview of lead sets out the adult position directly. Chronic exposure may cause renal toxicity, with depressed glomerular filtration observed below 20µg/dL. Lead causes cardiovascular toxicity with no apparent threshold. Raised systolic blood pressure is identified as the critical adult cardiovascular endpoint, with the association put at approximately 1 mmHg higher systolic pressure for each doubling of blood lead. [2]
How lead affects the kidney
Renal toxicity was the first adult effect of lead to be established, and it was established in workers.
Occupational lead nephropathy, kidney damage in heavily exposed industrial workers, has been documented since the nineteenth century, at exposures far above anything encountered environmentally today. The mechanism operates principally on the proximal tubule, the segment of the nephron responsible for reabsorbing filtered substances back into the bloodstream. Lead accumulates in tubular cells, where it disrupts mitochondrial function and generates oxidative stress. Prolonged exposure produces interstitial fibrosis: functional tissue is progressively replaced by scar tissue, and filtration capacity falls.
The historical evidence base therefore comes from concentrations that no longer occur outside industrial accidents. What has changed in the past twenty years is the question being asked. The issue is no longer whether high occupational exposure damages kidneys, which is settled, but whether ordinary environmental exposure measurably affects kidney function across a whole population.
What kidney function is, and how it is measured
Kidney function is expressed as estimated glomerular filtration rate, or eGFR, the volume of blood the kidneys filter per minute, standardised to 1.73m² of body surface area.
The NHS treats a reading above 90 mL/min/1.73m² as normal function. Below 60 indicates Stage 3 chronic kidney disease or worse. At the 2022 Health Survey for England, around 11% of adults aged 35 and over had chronic kidney disease at stage 3 to 5. [3]
eGFR also declines naturally with age, typically by around 0.8 to 1 mL/min/1.73m² per year after the age of forty. That figure is worth holding in mind when reading the effect sizes below, because it provides the only sensible yardstick for judging whether a lead-associated decrement is trivial or substantial.
The kidney evidence
Three studies carry most of the weight in current risk assessment, and they were selected precisely because they measure effects at low, contemporary blood lead concentrations rather than occupational ones.
The European benchmark
The European Food Safety Authority modelled the dose-response relationship for chronic kidney disease using United States national survey data from 1999 to 2006, a cross-sectional analysis of 14,778 adults aged 20 and over with a geometric mean blood lead of 1.58µg/dL. [4]
Benchmark-dose modelling was applied to the relationship between blood lead and the prevalence of Stage 3 or worse chronic kidney disease. Fitting a range of models at a 10% benchmark response, EFSA derived a BMDL10 of 15µg/L blood lead, or 1.5µg/dL, for nephrotoxicity. [5]
The technical meaning is worth stating precisely. A BMDL10 is the lower confidence limit on the dose associated with a 10% extra risk. It is a conservative regulatory reference point, not an observed effect at that exact concentration, and the modellers deliberately used the lower bound rather than the best-fit line.
Its strength is the sample size and the low exposure range. Its limitation, which EFSA acknowledged, is that a cross-sectional study captures a snapshot: it shows that people with higher blood lead have more kidney disease, but it cannot show that lead exposure changing over time causes kidney disease to change over time.
The Swedish cohort
That limitation is what the second study addresses. A prospective population-based cohort followed 4,341 adults aged 46 to 67 in Malmö, Sweden, with a median blood lead of 2.5µg/dL, around a quarter of the concentration at which UK public health teams are notified for adults. [6]
Adults in the highest blood lead quartile had a hazard ratio for incident chronic kidney disease of 1.49 against the lower three quartiles combined, with a confidence interval from 1.07 to 2.08. The trend across quartiles was significant at p = 0.001, with eGFR decline steeper in the third and fourth quartiles.
A continuous analysis found each 1µg/dL increase in blood lead associated with an eGFR change of −0.38 mL/min/1.73m², with a confidence interval from −0.77 to −0.02 and a p-value of 0.06, at the boundary of conventional significance and reported as such.
The adjusted model accounted for age, sex, smoking, alcohol intake, hypertension, diabetes, waist circumference, baseline eGFR and education level. The authors named their own limitations plainly: blood lead was measured only at baseline, the number of chronic kidney disease cases was moderate, and unmeasured confounding could not be excluded.
The Korean cross-section
The third study used Korean national survey data for 2008 to 2010, covering 5,924 adults with a median blood lead of 2.29µg/dL. In multiple linear regression on log-transformed blood lead, eGFR fell by 2.624 mL/min/1.73m² for every doubling of blood lead, with a confidence interval from −3.803 to −1.445. [7]
A categorical analysis found a difference of 3.835 mL/min/1.73m² between the highest and lowest blood lead quartiles. The association was present at concentrations below 10µg/dL.
Its particular strength is adjustment for cadmium and mercury, both established nephrotoxins and both correlated with lead exposure, which addresses one of the most obvious confounding objections. Its limitation, as the Inspectorate’s analysis noted, is that Korean population demographics may make the relationship less transferable to England and Wales.
Why the disagreement matters
These three do not agree on magnitude, and the difference is consequential.
When the Inspectorate’s analysts ran all three, the Korean relationship produced valuations between the European upper bound and the Swedish lower bound. Rather than choosing one, they modelled the European and Swedish relationships as explicit upper and lower bounds on the benefit of reducing exposure, because the choice between them changes the economics of national lead policy substantially. [1]
That is an honest treatment of an uncertain effect, and it should be carried through into any account of the evidence. The direction of the association is consistent across three different designs in three different populations. The size of it is not settled.
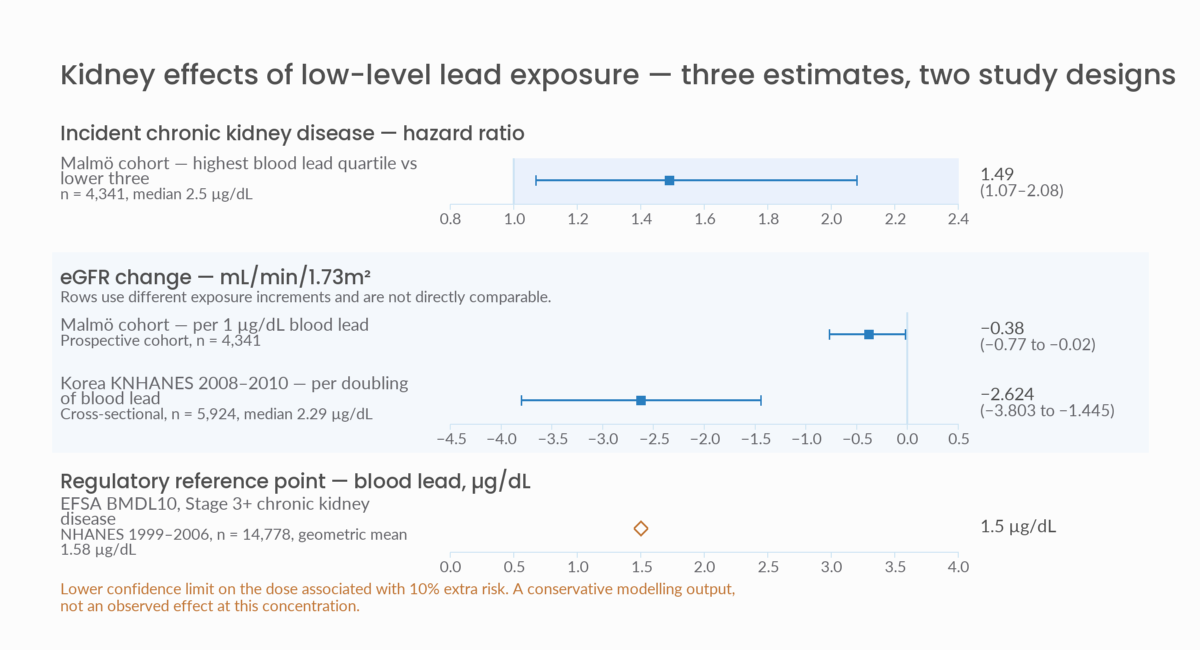
Figure 1. Three estimates of the association between low-level blood lead and kidney function. The direction is consistent across two study designs and three populations; the magnitude is not comparable between panels, and the EFSA value is a modelled regulatory reference rather than a measured effect.
Putting the numbers in context
A decrement of 2.6 mL/min/1.73m² per doubling of blood lead means little in isolation.
Set against natural age-related decline of roughly 1 mL/min/1.73m² per year, it is equivalent to two to three years of additional kidney ageing. For a person with normal function that is unlikely to be clinically visible. For a population, it shifts the whole distribution, and it is the number of people crossing below 60, the threshold for Stage 3 disease, that determines how many are diagnosed, monitored and treated.
This is the same distributional logic that governs the childhood IQ evidence. The individual effect is small and invisible. The population effect appears at the threshold.
Blood pressure and cardiovascular risk
Why systolic pressure is the endpoint
Systolic blood pressure was selected as the measure in both major risk assessments for practical reasons. It is reported more frequently than diastolic pressure in the underlying studies; where both are reported, lead has the stronger effect on systolic; and systolic pressure may be the more important risk factor for cardiovascular morbidity and mortality in its own right. [10]
Hypertension is diagnosed at a systolic pressure of at least 140 mmHg together with a diastolic pressure of at least 90 mmHg, measured at rest.
The consequences of shifting systolic pressure are well quantified. Ettehad and colleagues’ 2016 meta-analysis of 123 studies found that each 10 mmHg reduction in systolic pressure was associated with relative risks of 0.80 for major cardiovascular events, 0.83 for coronary heart disease, 0.73 for stroke, 0.72 for heart failure and 0.87 for all-cause mortality, reductions of roughly 20%, 17%, 27%, 28% and 13% respectively. The review found no evidence of a threshold below which the relationship disappeared. [11]
What lead contributes
Two regulatory bodies have quantified the lead contribution, and they took different approaches.
EFSA reviewed the literature and concluded that the evidence pointed to a causal relationship between blood lead and systolic pressure, describing it as a relatively weak but persistent and significant association. From the studies it selected, EFSA derived a BMDL01 of 3.6µg/dL blood lead, corresponding to a 1% increase in systolic pressure, about 1.2 mmHg against a reference of 120 mmHg, averaged across the population. [5]
Health Canada’s 2010 toxicological review took a different route, because no suitable pooled analysis existed. Its authors judged the published meta-analyses too heterogeneous to give a reasonable combined estimate, and pooled and analysed the available data themselves. They arrived at three separate linear relationships rather than one, ranging from 0.05 to 0.47 mmHg per µg/dL of blood lead depending on the population group. [10]
Separately, meta-analyses examining a non-linear relationship have found that doubling blood lead corresponds to roughly a 1 mmHg increase in systolic pressure, the figure UKHSA cites in its own toxicological overview. [2]
A caveat the source insists on
Health Canada attached an explicit warning to its own coefficients, and it deserves repeating rather than burying.
The relationships were assumed to be linear below about 4µg/dL in the absence of evidence to the contrary, but the review recommended that any estimate of the slope below that concentration be accompanied by an explicit statement qualifying the additional uncertainty involved, because the relationship had not been examined for non-linearity over the lower range of the available data. [10]
That is the range most relevant to contemporary environmental exposure in Britain. The coefficients are the best available; they are also least tested precisely where they matter most now.
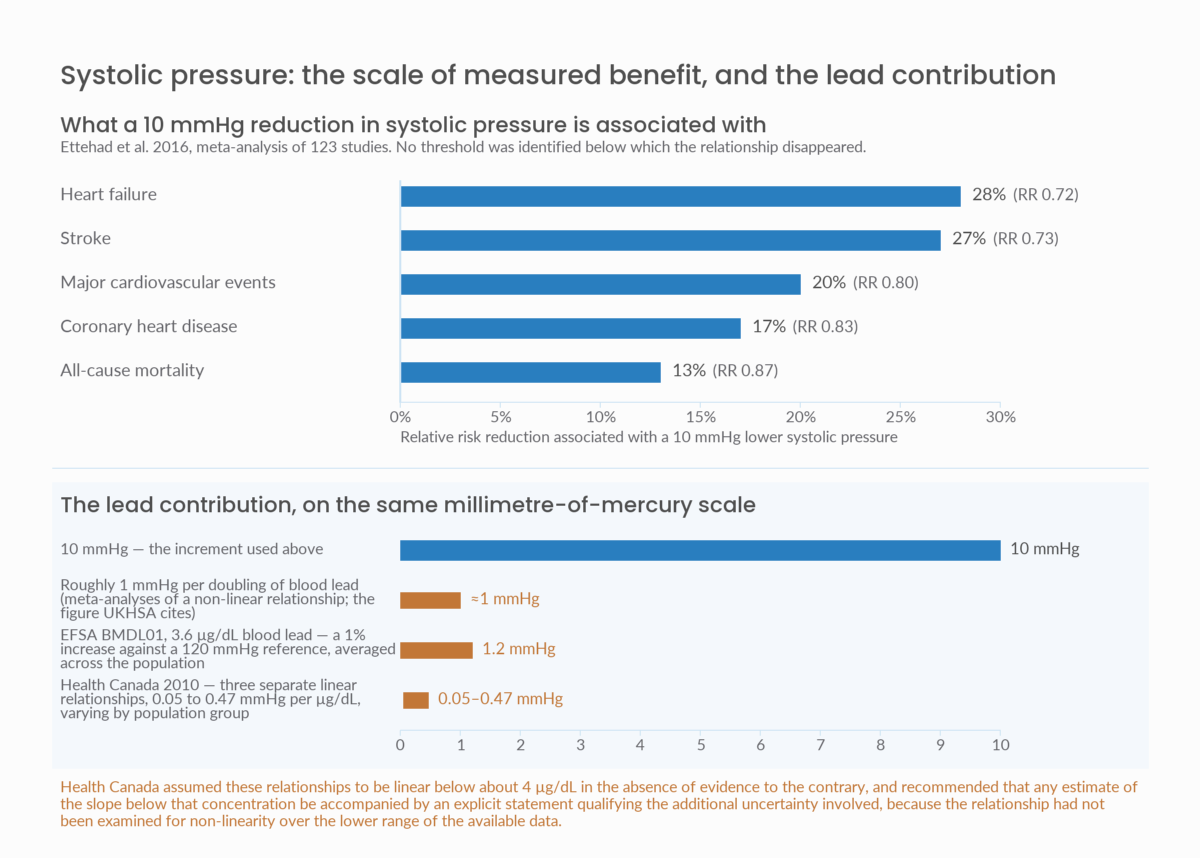
Figure 2. Blood pressure benefits are quantified per 10 mmHg of systolic reduction. The contribution attributed to lead is a fraction of that increment, estimated on different exposure scales by different bodies. The two panels share only the millimetre-of-mercury axis; no risk reduction should be read across from one to the other.
Where the coefficients come from
The underlying studies are worth knowing, because they explain both the strength and the limits of the relationship.
The 0.25 mmHg per µg/dL slope derives from a study of 496 former and current male employees of a United States chemical manufacturing facility. Their average age was 55.8 years, average time since occupational exposure was 17.7 years, and average blood lead was 4.6µg/dL with a range from 1 to 20µg/dL. Mean systolic pressure in the same cohort was reported at 127.9 mmHg. [10]
The steeper 0.47 mmHg per µg/dL slope derives from a national survey analysis of around 2,300 women with a mean blood lead of 3.4µg/dL, mean age 42, and mean systolic pressure of 122.4 mmHg. [10]
Both are populations with blood lead concentrations in the low single figures, in other words contemporary environmental rather than industrial exposure, even though one cohort reached those concentrations by way of an occupational history.
A genuine disagreement about susceptibility
EFSA and Health Canada, reviewing overlapping literature, reached different conclusions about whether lead affects all adults equally.
EFSA concluded that all adults were equally susceptible to the cardiovascular effects of lead exposure. Health Canada concluded that susceptibility varied substantially between population groups, and that the variation was too large to disregard, which is why it produced three coefficients rather than one, applying the steepest to the group it identified as most susceptible and the shallowest to those least so. [1, 5, 10]
The Inspectorate’s analysis adopted the Health Canada approach on the grounds that the variation could not be ignored. It is an unresolved question, and one that anyone quoting a single figure for the lead and blood pressure relationship should be aware of.
Beyond blood pressure
The strongest cardiovascular finding in the recent literature does not run through blood pressure at all.
A 2018 analysis linked United States national survey data for 14,289 adults to mortality records, following participants for a median of 19.3 years. The geometric mean blood lead was 2.71µg/dL, with concentrations ranging from 1.0 to 56µg/dL. Over the follow-up period there were 4,422 deaths, including 1,801 cardiovascular deaths and 988 from ischaemic heart disease. [12]
Comparing the 10th and 90th percentiles of exposure, 1.0 against 6.7µg/dL, produced hazard ratios of 1.37 for all-cause mortality, 1.70 for cardiovascular mortality and 2.08 for ischaemic heart disease mortality.
The authors estimated population-attributable fractions of 18% for all-cause mortality, 28.7% for cardiovascular mortality and 37.4% for ischaemic heart disease mortality.
Those are substantial figures and should be read for what they are: attributable fractions from an observational cohort, sensitive to residual confounding, in a United States population with higher historical exposure than Britain today. They are not a UK estimate, and the study cannot establish causation on its own. What makes them notable is that the exposure range they describe overlaps closely with the range examined in the kidney studies, and that the relationship persisted after adjustment for conventional cardiovascular risk factors.
Who is most susceptible
Susceptibility is not uniform, and the evidence points in several directions at once.
Health Canada’s finding of differential susceptibility to blood pressure effects has already been described. On the kidney side, a 2022 analysis using genetic data from British and Australian datasets found a potentially causal effect of genetically determined blood lead on reduced renal function in people with type 2 diabetes, but not in those without, suggesting that existing metabolic disease may amplify the effect. [13]
That fits a broader pattern in which lead appears to matter most to people whose organ function is already compromised. Diabetes, existing chronic kidney disease and existing hypertension are all plausible amplifiers, and all are common. Around 11% of adults aged 35 and over in England already have Stage 3 or worse chronic kidney disease; around 30% have hypertension. [3, 8]
What has changed recently
The evidence has strengthened without becoming simpler.
On the cardiovascular side, a 2025 dose-response meta-analysis pooling 24 studies and 181,500 participants found a pooled odds ratio of 1.27 for hypertension, with a confidence interval from 1.20 to 1.34, though with high heterogeneity between studies. [14] A 2025 prospective cohort following 1,818 adults from 1998 to 2019 found non-linear dose-response relationships, with a clear increase in cardiovascular and coronary mortality risk above 35µg/L blood lead. A 2024 Swedish study linked lead exposure to coronary artery calcification in men, adding a European mechanistic correlate. [15]
On the kidney side the picture is more cautious. A 2024 systematic review of chronic lead exposure and kidney injury markers rated the certainty of the evidence as very low, a reminder that a consistent observational signal is not the same as causal precision.
No post-2021 United Kingdom adult cohort study on either outcome was identified. The low-dose kidney relationship remains heterogeneous rather than resolved.
What the evidence does not support
It is as important to be clear about the limits of the adult evidence as about its content.
Cancer. Health Canada concluded that carcinogenicity could not be ruled out and that there is sufficient evidence for carcinogenicity in animal experiments, but that human epidemiological evidence is limited, with small case numbers restricting interpretation. EFSA concluded that because lead is not a direct-acting genotoxin, and because the doses that induce tumours in rodent experiments are very high relative to human intake, human exposure through food is unlikely to represent a significant cancer risk. The Inspectorate’s review found insufficient evidence to quantify any relationship between blood lead and cancer prevalence at low concentrations, and noted that the threshold for observable effects is much higher than for renal, cardiovascular or neurological effects. [1, 5]
Reproductive and other effects. EFSA’s position is that lead affects reproduction, the immune system and other organs, but that these effects appear only at higher exposures. Elevated maternal blood lead in the first and second trimesters has been associated with premature delivery, and blood lead above 5µg/dL may delay pubertal development, but the Inspectorate’s review concluded there is insufficient evidence to quantify reproductive or developmental relationships at low concentrations. [1]
In short, the adult case rests on kidney and cardiovascular outcomes. It does not rest on cancer, and it should not be argued as though it does.
How strong is this evidence
Weaker than the childhood evidence, and it should be presented that way.
Several key studies are cross-sectional, which limits inference about change over time. The kidney relationships disagree by enough that the regulator’s own analysis used two of them as uncertainty bounds rather than selecting one. The blood pressure coefficients carry an explicit warning from their own authors about uncertainty at exactly the low concentrations now most relevant. The strongest cardiovascular result comes from a United States cohort with higher historical exposure than contemporary Britain.
What gives the evidence weight is consistency of direction, across cross-sectional and longitudinal designs, across American, Swedish and Korean populations, and across kidney, blood pressure and mortality endpoints. Consistency of direction is not the same as precision about size, and the honest position is that the direction is established and the magnitude is not.
One further gap deserves naming. There appears to be no recent nationally representative blood lead biomonitoring for United Kingdom adults. Adult testing takes place, but on a case and threshold basis, which is not the same as knowing how adult exposure is distributed across the country. The published surveillance is child-focused. Nobody can currently state with confidence what the adult blood lead distribution in Britain looks like.
Drinking water and adult exposure
For adults, drinking water occupies a particular position among exposure routes.
Adults are not exposed to the hand-to-mouth pathways that dominate childhood exposure, and are less affected by household dust and contaminated soil. They do not typically ingest paint fragments. What they do is drink water, every day, for decades, and where that water passes through lead pipework, solder or fittings, the exposure is continuous and cumulative in a way that intermittent sources are not.
That is why the modelling underpinning national lead policy treats water lead concentration at the tap as a primary determinant of adult blood lead, alongside age and location. [1] It is also why the practical response is the same at every age. The evidence linking lead in drinking water to measured blood lead is set out in our article on lead in drinking water and blood lead concentrations, and the childhood evidence in our article on lead exposure and children’s neurodevelopment.
What this means in practice
Nothing in the adult evidence changes what should be done. It changes who has a reason to do it.
The associations described here were detected at median blood lead concentrations between roughly 1.6 and 2.7µg/dL. The public health notification threshold for adults in England is 10µg/dL. [16] These are not the concentrations of industrial poisoning or acute toxicity; they are ordinary contemporary exposures, of the kind that a household on a lead supply pipe may experience without any indication that anything is wrong.
A household with no children is not a household without exposure risk. The case for identifying and removing lead pipework does not depend on who currently lives in the property, and it does not become irrelevant when children grow up and move out. Guidance on establishing whether lead pipework is present is set out in our article on older housing and legacy lead water pipes.
References
- Hulance J, Kowalski T, Fairhurst S. Long-term strategies to reduce lead exposure from drinking water. Report DWI14372.2. Swindon: WRc for the Drinking Water Inspectorate; 2021.
- UK Health Security Agency. Lead: toxicological overview. London: UKHSA.
- NHS England. Health Survey for England 2022, part 2: kidney disease. Leeds: NHS England; 2023.
- Navas-Acien A, Tellez-Plaza M, Guallar E, Muntner P, Silbergeld E, Jaar B, et al. Blood cadmium and lead and chronic kidney disease in US adults: a joint analysis. Am J Epidemiol. 2009;170(9):1156-64.
- EFSA Panel on Contaminants in the Food Chain. Scientific opinion on lead in food. EFSA J. 2010;8(4):1570.
- Harari F, Sallsten G, Christensson A, Petkovic M, Hedblad B, Forsgard N, et al. Blood lead levels and decreased kidney function in a population-based cohort. Am J Kidney Dis. 2018;72(3):381-9.
- Kim Y, Lee BK. Associations of blood lead, cadmium and mercury with estimated glomerular filtration rate in the Korean general population. Environ Res. 2012;118:124-9.
- NHS England. Health Survey for England 2024: adults health. Leeds: NHS England; 2025.
- Public Health England. Health matters: combating high blood pressure. London: PHE; 2017.
- Healey N, Jones-Otazo H, Walker M, Knafla A. Toxicological review and recommended toxicological reference values for environmental lead exposure in Canada. Ottawa: Prepared for Health Canada; 2010.
- Ettehad D, Emdin CA, Kiran A, Anderson SG, Callender T, Emberson J, et al. Blood pressure lowering for prevention of cardiovascular disease and death: a systematic review and meta-analysis. Lancet. 2016;387(10022):957-67.
- Lanphear BP, Rauch S, Auinger P, Allen RW, Hornung RW. Low-level lead exposure and mortality in US adults: a population-based cohort study. Lancet Public Health. 2018;3(4):e177-84.
- Genetically determined blood lead and reduced renal function in type 2 diabetes: a Mendelian randomisation analysis. J Mol Med. 2022.
- Relationship between lead exposure and different types of hypertension: a systematic review and dose-response meta-analysis. Front Public Health. 2025.
- Exposure to lead and coronary artery atherosclerosis. J Am Heart Assoc. 2024.
- UK Health Security Agency. Lead: environmental and public health intervention. London: UKHSA.
Disclosure
This article is published by London & Surrey Water Services Ltd, a CIPHE member and WaterSafe registered contractor whose business includes lead pipe replacement. The company therefore has a commercial interest in the subject matter. The article is restricted to findings and positions reported in the sources cited, and no claim is made here that is not traceable to those sources. It is not medical advice. Readers concerned about lead exposure should speak to their GP, and readers concerned about lead in their own water supply should contact their water supplier or seek independent laboratory testing.