

Introduction
Scotland’s history of violence is usually explained through deprivation, alcohol, industrial decline, policing, family breakdown and social dislocation. Those explanations remain the substance of it. This article asks a narrower question: whether historic lead exposure through drinking water belongs alongside them as one possible contributing factor. It does not argue that lead explains Scottish violence, and nothing here is a claim about the causes of crime in any city today.
What can be established is the exposure. For much of the twentieth century lead in Scotland was part of ordinary domestic life — in service pipes, household plumbing and lead-lined tanks — and in cities such as Glasgow and Edinburgh the soft, acidic supply dissolved lead from that pipework into the water people drank. A UK survey in 1975–76 found 34.4% of Scottish households at or above 50 µg/L on a random daytime sample against 7.8% in England and Wales, as reported in later summaries of that survey. That 34.4% is cumulative: 21% of Scottish households were at or above 100 µg/L and a further 13.4% fell in the 50–100 band. Summaries that give 33% for Scotland and 10% for England are rounding the same cumulative figure, not counting a second survey.[20] In Glasgow in 1976, with untreated Loch Katrine water at pH 6.3, only 45% of samples met the 100 µg/L limit then in force.[18]
What cannot be established is the size of any effect on offending. No Scottish study links annual water lead to annual violent crime, no city-level coefficient exists, and the international estimates come from countries with different exposure routes and different data. So the strongest claim this article makes is the one the Scottish Government’s own crime review makes: none of the existing research treats lead as the main cause of violent crime, though it is argued to be a major explanatory factor in variation between places.[10] What follows sets out the exposure, the behavioural evidence, and the four separate changes that could each explain the later decline.
Glasgow and Edinburgh are central to this story, but in different ways. Glasgow provides one of the clearest examples of a severe citywide drinking-water lead problem. Edinburgh gives us one of the most important Scottish studies linking blood lead levels in children to behaviour. Together, they allow us to ask a difficult but important question: did Scotland’s historic lead exposure contribute, at least in part, to later patterns of violent behaviour?
Table of Contents
Why Scotland Was Especially Vulnerable to Lead in Drinking Water
Scotland’s drinking-water lead problem had a particular chemistry behind it. Lead pipes are more likely to leach lead into water where the water is soft and acidic. Many Scottish supplies, especially from upland sources, had exactly those characteristics. Glasgow’s supply from Loch Katrine, for example, had a recorded pH of around 6.3 in 1976 — notably acidic and highly plumbosolvent.[2] Where that water passed through lead pipes, lead joints or lead-lined storage tanks, the risk increased substantially.
This made Scotland unusually vulnerable. Old plumbing was already common. Older tenements and houses often retained lead service pipes, internal lead pipework or lead-lined tanks. Once lead was in contact with soft, acidic water, it could enter the household supply in significant quantities.
This was not only a technical water issue. It was also a housing issue. In older urban areas, the people most exposed were often those least able to change the plumbing. Many households were tenants, not owners. Even if a family suspected that lead was present, replacing pipes or tanks was not always within their control.
By the mid-1990s, the Scottish Office estimated that 589,000 homes in Scotland still contained lead pipes — a Scottish Office figure, cited in the House of Commons Library research paper.[1] This was not a small remnant of a vanished era. It was a live public-health problem concentrated in older urban neighbourhoods.
Glasgow’s Water Lead Problem
Glasgow is the clearest example in Scotland of a severe drinking-water lead problem. The city’s historic supply from Loch Katrine was celebrated as a great civic achievement, but the water’s chemistry created a major problem where it met lead pipes and plumbing. The water was soft and plumbosolvent, meaning it actively dissolved lead from the pipework carrying it into homes.
The numbers were serious. In 1976, when the untreated Loch Katrine supply had a pH of 6.3, only 45% of Glasgow samples complied with the limit then in force of 100 µg/L.[18] Lime dosing from 1978 changed that quickly: compliance rose to 83% by 1980 at a pH of 7.8, and to 99% by 1982.[18] Mean and median maternal blood lead fell by 51% and 60% respectively, and the proportion of mothers above 1.5 µmol/L fell from 7.5% in 1977 to 0.4% in 1980.[19] A later study re-expressed the 1981 Glasgow samples against the 10 µg/L guideline adopted afterwards: 49% would have failed it, against 17% in 1993.[15] Ten micrograms per litre was not the standard in 1981; the limits then in force were 50 and 100 µg/L. The significance was especially acute for infants and pregnant women. Lead in tap water could pass directly into bottle feeds: even in 1993, after maximal treatment, 13% of infants in the Loch Katrine supply area were exposed through bottle feeds to tap water at or above 10 µg/L.[15] Raised maternal blood lead was also associated with tap-water lead, meaning Glasgow’s problem was not simply about old houses or regulatory breaches. It was about exposure at the most sensitive stages of human development.
Lime dosing, pH correction and later orthophosphate cut exposure sharply. That was a genuine public-health success. It was not a lead-free supply. In 1993, 17% of households in the Loch Katrine area still sat at or above the later 10 µg/L guideline, and 13% of infants were still exposed through bottle feeds at that level.[15]
But even after major treatment improvements, a meaningful minority of homes still exceeded guideline levels — and treatment had not replaced the pipes. Where the pipework remained, the source of exposure remained as well.
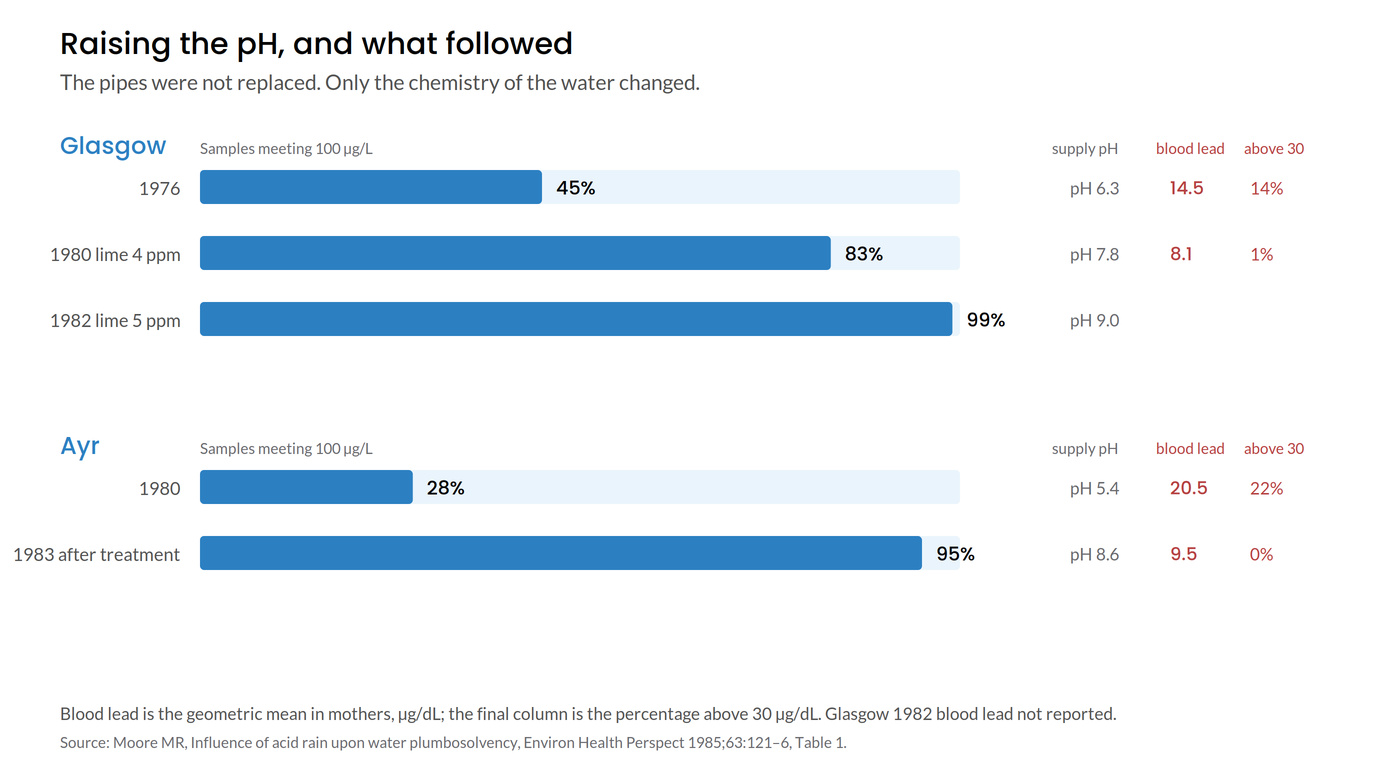
Raising the pH, and what followed. The pipes were not replaced; only the chemistry of the water changed. Blood lead is the geometric mean in mothers. Source: Moore MR, Influence of acid rain upon water plumbosolvency, Environmental Health Perspectives 1985;63:121–6, Table 1.
Edinburgh’s Exposure Problem
Edinburgh’s lead problem had a different evidence base, but it was just as important. The Edinburgh Lead Study, published in 1989, assayed blood lead in 855 children across 18 primary schools in central Edinburgh and analysed a sub-sample of 501 aged 6 to 9. It measured blood lead directly — finding a mean of 10.4 µg/dL in that sub-sample — and compared those levels with behaviour assessed using the Rutter behaviour scales, completed by both teachers and parents.[3]
The study found that higher blood lead levels were associated with worse teacher-rated behaviour, particularly aggressive or anti-social behaviour and hyperactivity, after controlling for 30 potential confounding variables. It also found elevated indoor dust lead levels in the homes of the children studied, with a mean of 308 µg/g that increased with housing age.[3] That points to lead paint and dust as a second exposure pathway alongside drinking water.
The later follow-up study, published in 1998, showed that water treatment and plumbing changes could reduce both household water lead and blood lead over time.[4] But it also showed that homes without lead plumbing had far lower lead levels in their water than homes with lead pipes or lead-lined tanks. The lesson was clear: treatment can reduce exposure, but replacement deals with the source.
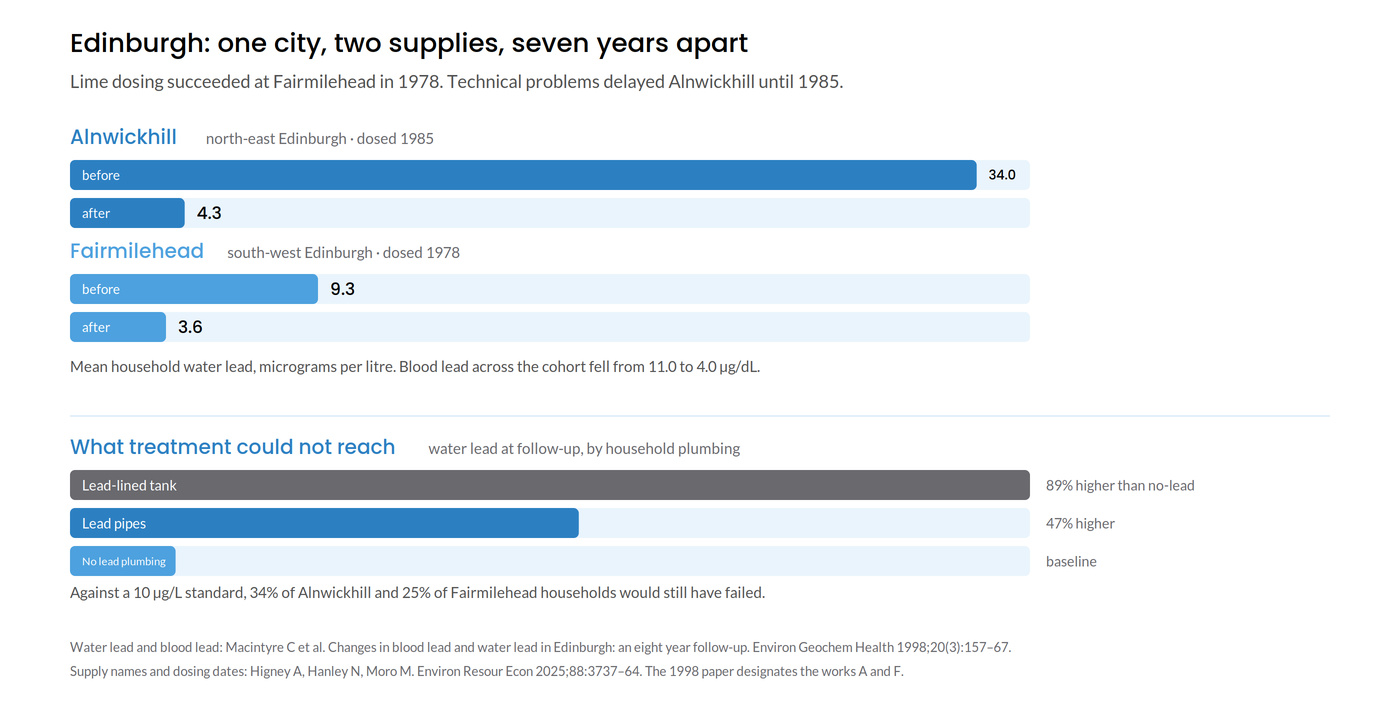
Edinburgh’s two supplies were treated seven years apart, and what a house was plumbed with still decided where it sat. Water and blood lead from Macintyre et al. 1998; supply names and dosing dates from Higney, Hanley and Moro 2025. The 1998 paper designates the works A and F.
Why This Matters for the Crime Question
Before we even reach crime statistics, Glasgow and Edinburgh establish the first essential point: Scottish cities really did expose large numbers of people to lead through drinking water and older homes. The national survey of 1975–76 found 34.4% of Scottish random daytime samples at or above 50 µg/L, against 7.8% in England and Wales. Published summaries of that survey differ: the Commons Library gives 13.4% for Scotland and 5.2% for England, which is the 50–100 µg/L band alone rather than the total above 50, and elsewhere quotes the World Health Organization at 33% and 10%.[20] In Glasgow the position was worse still: in 1976 only 45% of samples complied with the 100 µg/L limit then in force.[18] These are not background noise. They indicate an exposure environment capable of raising blood lead levels in children to ranges now associated with measurable cognitive and behavioural impacts.
That matters because lead is not only a water-quality issue. It is a neurotoxin. It affects the developing brain, particularly the systems involved in attention, impulse control and emotional regulation. It is associated with attention problems, impulsivity, aggression, poor self-control and behavioural disruption. Those traits are also well-established risk factors for later offending, especially violent offending.
So the question is not whether lead “caused” Scottish violence in a simple way. The question is whether high early-life lead exposure may have increased the population-level risk of aggressive and impulsive behaviour in cities already under serious social strain.
That is where the lead-crime hypothesis comes in.
The Lead-Crime Hypothesis
From Public Health Concern to Crime Theory
The lead-crime hypothesis grew out of two bodies of evidence.
The first was medical and developmental: lead damages the brain, especially in early life. The second was criminological: aggressive behaviour, impulsivity, poor attention and low self-control are well-established risk factors for later offending.
The hypothesis joined these two ideas. If lead exposure damages the parts of the brain involved in attention, impulse control and emotional regulation, then widespread childhood exposure might raise the later risk of violent behaviour at population level.
The theory does not require lead to create criminals in a crude or deterministic way. Rather, it suggests that lead can push risk upward. In a city where many children are exposed, even a modest shift in behaviour and self-control could matter years later.
From Research to Public Debate
The lead-crime hypothesis moved from academic research into wider public discussion largely through Kevin Drum’s 2013 feature in Mother Jones, “America’s Real Criminal Element: Lead.” Drum did not originate the theory, but he gave it a powerful public narrative, drawing together research from public health, economics and criminology to present lead as a possible hidden driver behind the rise and fall of violent crime.
The basic argument was that violent crime rose after the postwar expansion of leaded petrol and fell after lead exposure declined — with a lag of roughly two decades, matching the time it would take exposed children to reach the peak ages for violent offending. Drum’s follow-up piece, “Lead and Crime: A Linkfest,” kept the debate alive by gathering subsequent studies, challenges and related findings.
That journalism did not settle the science, but it made the hypothesis impossible to ignore in public discussions of crime and environmental policy.
Why the Theory Caught Global Attention
The lead-crime hypothesis became compelling because it appeared across different countries and different contexts. Rick Nevin’s international work compared preschool lead exposure and later crime trends across several Western countries, including Britain, and found striking alignments. The timing of exposure changes and later crime trends matched the developmental lag expected if childhood exposure affected later behaviour.
Jessica Wolpaw Reyes strengthened the argument by using variation between US states in the speed of lead exposure reduction. Her findings supported a relationship between childhood lead exposure and later violent crime. The Scottish Government’s reading of Reyes, including the weak result for murder specifically, is set out below.
The Serious Version of the Theory
The serious version of the lead-crime hypothesis is not that lead explains everything. It is that lead is one important risk factor among many.
Crime rises and falls because of many forces: poverty, policing, drugs, alcohol, unemployment, inequality, school exclusion, family instability, social norms and opportunity. Lead does not replace those explanations. It sits alongside them — with biological plausibility, international evidence and Scottish behavioural evidence behind it.
What International Research Says About Lead and Violent Crime
Rick Nevin and the International Time-Series Evidence
Rick Nevin’s 2007 work gave the hypothesis its international reach. He compared preschool lead exposure with later crime trends across multiple countries and found strong associations, with the key feature being the lag: childhood exposure appeared to line up with later crime trends after enough time had passed for exposed children to reach the peak years for offending — typically around 18 to 23 years, depending on the crime category.[6]
This was powerful because it was not confined to one city or one country. The pattern appeared across nations with different governments, policing systems and cultures. However, Nevin’s work was ecological in nature. It examined population-level trends and cannot by itself prove what happened to particular individuals. That is why subsequent work matters.
Jessica Reyes and State-Level Evidence
Jessica Reyes strengthened the argument by exploiting differences in how quickly US states reduced lead in petrol, building state-year panels with 20 to 30 year lags. Her findings supported a relationship between childhood lead exposure and later violent crime.[7] The Scottish Government’s own reading of her work is more precise, and matters here because this article is largely concerned with homicide: it records that she found only weak evidence for a relationship between lead and murder rates, no evidence of a link with property crime, but a significant association with violent crime.[10]
Her later work also linked early lead exposure to childhood behaviour problems, adolescent aggression and later criminal behaviour, helping to connect the theory back to developmental pathways rather than relying only on broad historical curves.
Cohort Studies and Individual-Level Evidence
The hypothesis becomes more convincing when individual-level studies are considered. Several cohort studies have followed people from early-life lead exposure into later behavioural or criminal outcomes. These studies do not produce identical results — some show stronger effects than others — but the overall pattern supports a link between early lead exposure and later antisocial behaviour, delinquency or violence.
A systematic review by Talayero and colleagues, published in PLOS Global Public Health in 2023, concluded that diverse individual-level studies — measuring lead in blood, bone and dentine across multiple developmental windows — link early exposure to later delinquency, criminal and antisocial outcomes. The finding holds across different study designs and populations.[9]
This does not mean every exposed child becomes violent. It means exposure can increase risk at population level.
What Meta-Analysis Adds
The most important corrective in the literature comes from meta-analysis. Higney, Hanley and Moro’s 2022 meta-analysis, drawing on 542 estimates from 24 studies, found that publication bias had inflated some earlier estimates.[8] Their adjusted central estimates — a partial correlation of around 0.16 and an elasticity of around 0.09 — are more modest than the early claims.
Their illustrative calculations suggest that lead abatement plausibly explains around 7 to 28% of the major late-20th-century homicide decline in the United States[8] — meaningful, but not dominant. Even at the upper end of that range, most of the decline would remain unexplained by lead.
That is not a failure of the theory. It is a necessary correction. The better conclusion is: lead exposure appears to be a meaningful contributor to later violent crime risk, but not the primary or sole cause.
No equivalent figure can responsibly be given for Scotland. The Higney range is derived from United States data, and applying it here would require Scotland-specific longitudinal blood-lead series and a city-level causal model, neither of which exists. A Scottish number produced by transposing the American range would be an arithmetic exercise rather than a finding, and this article does not offer one.
The One Study That Measured Lead From Water Pipes
Every study described so far measures lead from petrol. That matters, because the exposure this article is concerned with is lead dissolved from water pipes, and the two are not the same thing: different route into the body, different dose, different population exposed. One study measures the exposure directly.
Feigenbaum and Muller examined 545 American cities whose water pipe material was recorded in 1897, and compared their homicide rates between 1921 and 1936, by which time the first children exposed through the water supply had reached adulthood. Cities that used lead service pipes had homicide rates about 24% higher than cities that used iron, with annual estimates ranging from 14 to 36%. Excluding southern cities, which mostly used iron and had high homicide rates for unrelated reasons, the range rose to between 15 and 52%.[17]
What makes the study relevant here is not the size of the effect but how it was identified. The authors used the acidity of each city’s water. Among cities with lead pipes, more acidic water was associated with higher homicide; among cities with iron pipes, pH made no difference at all. A fall in pH from 7 to 6 was associated with roughly 10% more homicides in lead-pipe cities.[17] That is the plumbosolvency mechanism described earlier in this article, appearing as the identifying variation in an economic history paper.
The study also tests the objection that lead-pipe cities were simply poorer. Cities using lead pipes had higher death rates from cirrhosis and from infant diarrhoea, both previously linked to lead, but showed no excess of tuberculosis or typhoid, which track poverty. Lead pipes were also, if anything, more common in wealthier and better-educated cities, because lead was the more expensive and more durable material.[17]
This does not transfer to Glasgow as a number. It is American, it is city-level, and it covers a period ending in 1936. But it establishes the direction the evidence points for the specific exposure route this article is about, and it does so in the population where that exposure was universal rather than concentrated among the poor. Glasgow before 1978 had the conditions the study identifies as raising risk: a supply pH of around 6.3, and lead plumbing widespread through the older housing stock. Glasgow has not been placed within the distribution of the 545 cities the authors examined, so nothing is claimed here about where it would sit in that range. What the American data would predict for a city with that water chemistry is a higher homicide rate than an otherwise similar city without it. That is a cross-study inference, not a Scottish measurement.
The authors are careful about what follows. If lead exposure increases crime, they note, the response is lead removal; and even if it does not, removal still takes a dangerous toxin out of the environment, which is not true of most measures taken to reduce crime.[17]
The Scottish Evidence Base
What the Edinburgh Lead Study Established About Child Behaviour
The strongest direct Scottish evidence begins with the Edinburgh Lead Study, published in 1989. The researchers assayed blood lead in 855 children across 18 primary schools in a defined area of central Edinburgh, then selected a sub-sample of 501 aged 6 to 9 — weighted towards the top quartile of the blood-lead distribution — and assessed behaviour using the Rutter behaviour scales completed by both teachers and parents. Mean blood lead in that sub-sample was 10.4 µg/dL.[3]
After controlling for 30 possible confounding variables, the study found a significant relationship between blood lead and teacher-rated total behaviour problems, aggressive or anti-social behaviour, and hyperactivity. It did not find a significant relationship with the neurotic sub-score. Parent scores moved in the same direction, but did not reach statistical significance in the full model.
The paper’s plotted log-odds show a broadly linear rise across blood-lead groups, visually reinforcing the authors’ conclusion that there was a dose-response relationship with no evidence of a threshold. The authors also explain that the highest blood-lead group had about 2.4 times the odds of being in a worse behaviour category than an average child.[3]
That matters enormously for the Scottish case. The Edinburgh study did not measure later offending, but it did identify a clear association between lead exposure and the kinds of behavioural traits that later crime research repeatedly treats as relevant to violence: aggression, impulsivity, poor self-regulation and hyperactivity. In other words, it gives Scotland a local, child-level demonstration of the behavioural pathway that the wider lead-crime literature depends on.
What the Eight-Year Follow-Up Established About Water Lead and Blood Lead
The eight-year follow-up, published in 1998, added a second layer of evidence. It revisited 207 families from the original cohort, with 171 young people aged 14 to 17 providing a blood sample.[4] The follow-up showed that household water lead fell dramatically after improvements in treatment and some removal of lead plumbing.
In homes supplied from the treatment plant the authors designate A, mean water lead fell from 34.0 to 4.3 µg/L, an 87% reduction. In homes supplied from plant F, it fell from 9.3 to 3.6 µg/L, a 61% reduction. Over the same period, average blood lead fell from 11.0 µg/dL to 4.0 µg/dL.[4] The authors were explicit that these changes reflected both water treatment and the removal of lead plumbing.
But the follow-up also showed why treatment alone was not enough. Houses with no lead plumbing had water lead levels 89% lower than houses with lead-lined tanks and 47% lower than houses with lead pipes. About one-third of households with lead tanks were still predicted to exceed the then-current 50 µg/L EC limit, against 3% or less of the remaining households, and if a 10 µg/L standard were applied, 34% of households supplied from plant A and 25% from plant F would still have breached it.[4]
The follow-up paper’s histogram makes that pattern visually clear: homes with lead tanks cluster at the highest water-lead values, while homes with no lead seen or reported are concentrated much lower down the distribution. The authors described the overall reductions in water lead and blood lead as “an important achievement in public health”, while also warning that more progress would be required if lower standards were to be met.
What Scottish Government Crime Research Says About Early-Life Lead Exposure
The Scottish evidence does not stop at public health. In its review What Works to Reduce Crime?, the Scottish Government states that early-years lead exposure has been linked to aggressive behaviour, impulsivity and ADHD, all of which are recognised risk factors for offending behaviour.[10]
The review cites a meta-analysis of 19 studies on lead and conduct problems and notes that the association was remarkably consistent and not significantly weakened by controlling for potentially confounding factors such as home environment and social class.[10] It also summarises the crime literature in a notably careful way: the link is most clearly established in relation to violent crime, there is less consensus on property crime, and none of the existing research goes as far as to claim that lead exposure is the main cause of violent crime, though it is argued that lead is a major explanatory factor for variation in crime rates. That is the Scottish Government’s own formulation, and it is the claim this article makes.
That same review is useful for another reason. Its summary model of the underlying causes of crime places low self-control near the centre of the pathway to offending. The text then explains that people with low self-control are more likely to offend and to suffer a range of other negative life outcomes. That framing matters because it matches the developmental mechanism in the lead literature almost perfectly: if lead increases impulsivity, attention problems and aggressive behaviour, then it fits naturally into the Scottish Government’s own model of how risk accumulates long before crime is officially recorded.
Emerging Scottish Research — and Why Caution Still Matters
There is also newer Scottish research that adds both depth and caution. A 2025 University of Glasgow natural experiment examined drinking-water interventions that reduced lead levels in Glasgow and Edinburgh from 1978 onwards, using administrative data on more than 650,000 births between 1975 and 2000.[5]
The authors did not find consistent evidence that the interventions increased birthweight or reduced under-5 mortality, although they could not rule out the prevention of 1–3 deaths per thousand.[5] Importantly, they stressed that their focus was on short-run outcomes around birth, so the findings do not rule out longer-term impacts from early-life lead exposure.
That is an important nuance. The Scottish evidence base is getting stronger, but it still does not give us a neat city-level causal estimate for later violence.
Taken together, the Scottish evidence is strongest on three points. First, lead exposure in cities such as Edinburgh and Glasgow was real, measurable and historically serious. Second, in Scotland itself, higher childhood lead burden was associated with the kinds of behavioural problems that later violence research treats as highly relevant. Third, reducing exposure through treatment and plumbing change clearly lowered both water lead and blood lead.
Where the Scottish evidence is still thinner is on the final step: the direct measurement of how far those exposure changes translated into later offending or homicide trends. So the Scottish case is already strong on mechanism, behaviour and public health, but still more cautious on direct crime attribution.
Glasgow and Edinburgh Compared
Did Glasgow Have a More Severe Drinking-Water Lead Problem Than Edinburgh?
Both Glasgow and Edinburgh sat inside the same broader Scottish risk environment: upland, low-mineral, relatively acidic water meeting old lead plumbing. Glasgow was the more severely affected: in 1976 only 45% of its samples met the 100 µg/L limit then in force.[18] Glasgow and Edinburgh were also among the first Scottish cities to begin pH-raising treatment in the late 1970s because their water was so plumbosolvent.
The published evidence is not perfectly symmetrical. Glasgow’s clearest evidence is a large household-prevalence study in the Loch Katrine supply area. Even after maximal treatment, 17% of households still had tap water lead of 10 µg/L or more in 1993, against 49% of 1981 samples re-cut against that later guideline. Tap-water lead remained the main correlate of raised maternal blood lead, and 13% of infants were still exposed through bottle feeds to tap water at or above 10 µg/L.[15]
Edinburgh’s strongest evidence is structured differently. The original Edinburgh Lead Study found a mean child blood lead of 10.4 µg/dL in a sub-sample of 501 children, while the eight-year follow-up showed mean household water lead falling from 34.0 to 4.3 µg/L in one supply area and from 9.3 to 3.6 µg/L in the other. Blood lead fell from 11.0 to 4.0 µg/dL. The follow-up also showed that houses with no lead plumbing had water lead levels 89% lower than houses with lead tanks and 47% lower than houses with lead pipes.
Taken together, the evidence suggests Glasgow had the broader city-scale drinking-water lead burden, while Edinburgh provides the clearest Scottish evidence of what sustained exposure did to children.
Did Glasgow Later Experience Higher Levels of Violent Crime?
Set against lethal violence, the difference is stark. For 2003–04 to 2012–13 the official Scottish homicide table records 272 cases in Glasgow City against 80 in the City of Edinburgh.[11] Those are counts rather than rates, and the cities differ in size: Glasgow averaged around 578,000 people over the decade against roughly 460,000 in Edinburgh, giving rates of about 4.7 and 1.7 per 100,000 per year. Adjusting for population narrows the gap. It does not remove it. Nor does it make the two cities comparable: they differ substantially in deprivation, alcohol-related harm, industrial history, housing composition, population turnover and policing, and a comparison of this kind measures all of those at once. (Population figures are National Records of Scotland mid-year estimates on the current basis[16]; NRS revised its mid-2011 to mid-2021 series after Scotland’s Census 2022, so these differ from the figures published at the time.)
The gap then closed. In 2022–23 Glasgow City and the City of Edinburgh each recorded seven homicide victims, and Glasgow’s five-year total fell to 51 for 2018–19 to 2022–23, a 70% reduction from 171 in 2003–04 to 2007–08.[11]
That timing is worth stating carefully, because there is more than one clock running. Lime dosing from 1978, optimised through 1980, produced the first large cut in exposure[18,21]; children born into that supply turn eighteen between 1996 and 1998. Orthophosphate, added from 1989 to hold pH in the outer network where the water had aged and acidified again, produced the second; those children turn eighteen from about 2007. Glasgow City’s recorded homicide victims peak at 34 in 2006–07 and decline from there.[11] That is later than the Scottish national peak of 137 victims in 2004–05, and the two should not be conflated: annual local-authority victim figures are published only from 2005–06, so the Glasgow series cannot show whether the city peaked earlier. On the years available, the Glasgow turning point aligns temporally with the phosphate cohort rather than the lime one. Birth cohort plus eighteen is a reference marker rather than the lag itself: offending ages are broad, and a child who was five in 1978 matures on a different clock from one born that year. Two further clocks run alongside: leaded petrol was reduced from 1981 and removed in 2000, a national change affecting every Scottish city at once, and Scotland’s Violence Reduction Unit was founded in 2005. No published work separates the four.
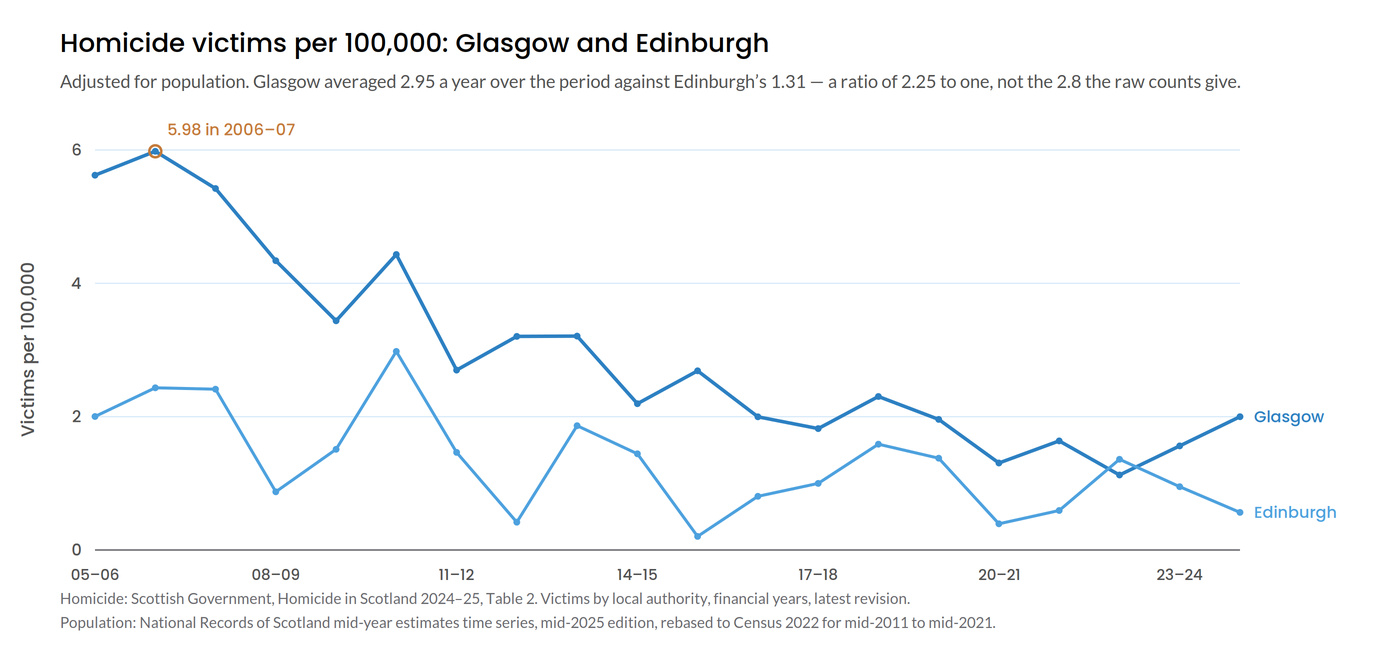
Homicide victims per 100,000 population. Adjusted for population the gap is 2.25 to one across 2005–06 to 2024–25, against 2.8 on raw counts; the 4.7 and 1.7 figures given in the text cover the shorter period 2003–04 to 2012–13. Homicide: Scottish Government, Homicide in Scotland 2024–25, Table 2, victims by local authority. Population: National Records of Scotland mid-year estimates time series, rebased to Census 2022 for mid-2011 to mid-2021.
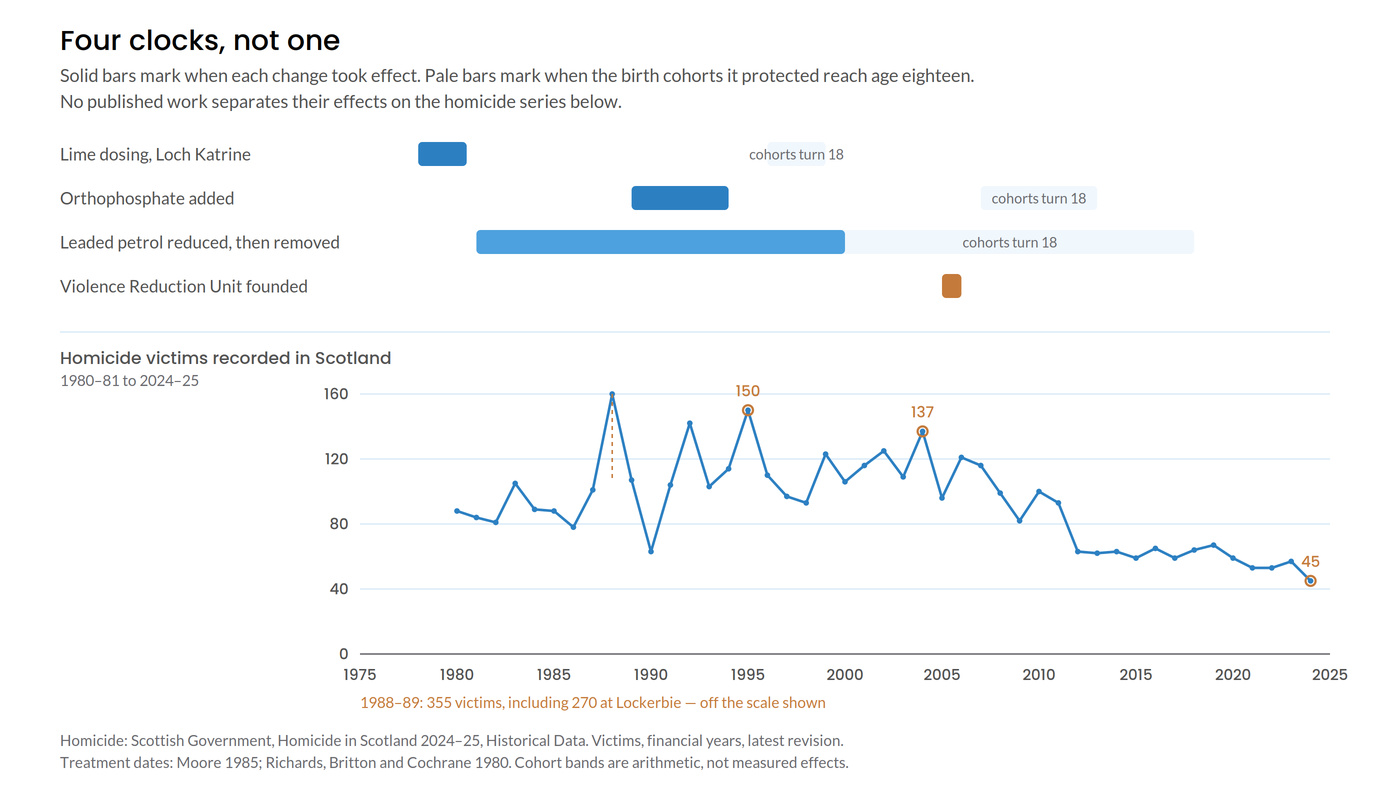
Four clocks, not one. Solid bars mark when each change took effect; pale bars mark when the birth cohorts it protected reach age eighteen. The homicide series beneath is recorded victims in Scotland. Sources: Scottish Government, Homicide in Scotland 2024–25, Historical Data; Moore 1985; Richards, Britton and Cochrane 1980. The cohort bands are arithmetic, not measured effects.
What the Historical Alignment Suggests — and What It Does Not Prove
Set side by side, the pattern is clearly suggestive. Glasgow has the stronger published evidence of a large, city-scale drinking-water lead burden and later showed a much heavier homicide burden. Edinburgh also had serious exposure, but its distinctive contribution is different: it produced the Edinburgh study showing that higher blood lead levels in children were associated with more aggressive, antisocial and hyperactive behaviour, even after extensive adjustment for confounders.
Those are precisely the kinds of traits the wider lead-crime literature treats as relevant to later violent offending. The Scottish Government’s own crime evidence review also links early-life lead exposure to aggression, impulsivity and ADHD, noting that the association appears strongest for violent crime.
There is a finding in the wider literature that bears directly on this comparison. Stretesky and Lynch, examining lead and crime at county level in the United States, found an interaction with deprivation: the association between lead and crime rates was strongest in the most deprived counties. Their explanation was that poorer areas have older, unrenovated housing and less access to screening and treatment.[10,22] That does not separate lead from deprivation in Glasgow. It does explain why the two are found together, and why any city-level comparison of this kind is measuring both at once.
But this is where the caution has to remain firm. The Scottish evidence base does not yet provide a published city-by-city statistical model that directly links annual drinking-water lead levels in Glasgow and Edinburgh to subsequent annual violent-crime rates. The Glasgow water studies are public-health studies. The Edinburgh papers are exposure, blood-lead and behaviour studies. The homicide bulletins are administrative crime statistics.
Put together, they create a historically plausible alignment and a strong behavioural mechanism, but not a direct quantified Glasgow-versus-Edinburgh lead-crime coefficient. The most defensible conclusion is therefore not that lead alone explains the Glasgow–Edinburgh violence gap, but that historically higher lead exposure in Glasgow may have been one important contributing factor among several.
Correlation, Causation and Caution
Why the Pattern Is Suggestive
The pattern is suggestive because several strands of evidence point in the same direction.
Scotland had unusually high drinking-water lead exposure. Edinburgh showed a link between blood lead and aggressive, anti-social and hyperactive behaviour in children. International studies link early-life lead exposure to later violent offending. Glasgow had a severe drinking-water lead problem and later a much heavier violence burden, which declined sharply from the mid-2000s.
The timing also matters. Major reductions in lead exposure occurred through a combination of drinking-water corrosion control, pipework changes and the reduction of leaded petrol. Around two decades later, Scotland’s violence trends began to shift downwards. That timing is compatible with a roughly two-decade lag after the major exposure cuts of the 1980s and early 1990s. It is not a single clock. Scotland’s national homicide peak is 137 victims in 2004–05; Glasgow City’s recorded peak, on figures published only from 2005–06, is 34 in 2006–07.[11] Either turning point lies closer to children born after orthophosphate dosing began in 1989 than to the first lime-dosed cohorts of 1978–80, and both also coincide with petrol-lead reduction and with the founding of the Violence Reduction Unit. No published work separates the four.
It is a historical alignment worth investigating.
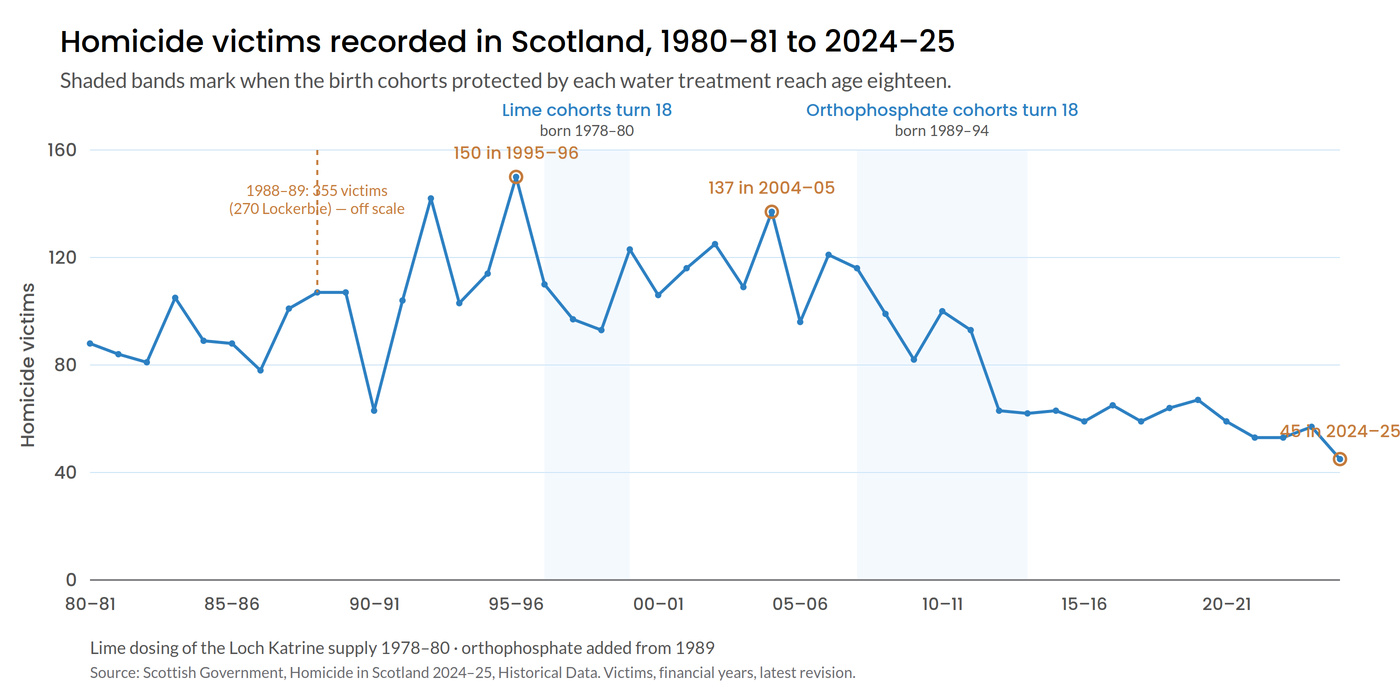
Homicide victims recorded in Scotland, 1980–81 to 2024–25. The 1988–89 figure of 355 includes the 270 victims of the Lockerbie bombing and is off the scale shown. Source: Scottish Government, Homicide in Scotland 2024–25, Historical Data. Victims, financial years, latest revision.
Why We Still Need Caution
Scotland’s violence decline has other strong candidate explanations that operated alongside any lead effect: recording-standard changes in the mid-2000s that affect trend interpretation; the tight entanglement of violence trends with alcohol and drug harms; concentrated deprivation in urban communities[13]; and the active policy shift toward a public-health approach to violence prevention.
There is no single published city-by-city Scottish study directly correlating annual water-lead levels with annual violent-crime rates. The water studies are public-health studies. The Edinburgh work is a child-behaviour study. The homicide figures are administrative crime statistics. When placed together, they create a plausible and serious picture — but not direct causal proof.
Lead as a Contributing Factor
The strongest defensible position is this: lead exposure should be treated as one contributing factor in Scotland’s urban violence story, alongside deprivation, alcohol, policing and the wider social conditions that dominate the literature. How much of the decline it accounts for is not known. The Scottish evidence base does not currently support putting a figure on it, and on the available estimates most of the decline cannot be attributed to lead.
That is more credible than overstating the case, and it fits the meta-analytic evidence better than early single-study claims. Lead may have acted as an amplifier — increasing population-level risk in cities already shaped by poverty, unemployment, housing stress, alcohol, school exclusion and policing patterns.
That is serious enough.
What Scotland’s Violence Reduction Model Suggests About Prevention
Scotland’s later success in reducing serious violence is important because it shows how the country eventually reframed the problem. The Scottish Violence Reduction Unit did not treat violence only as a law-and-order issue. It treated it as a public-health issue: something shaped by early life, poverty, inequality, despair, alcohol, trauma, peer groups and community conditions.
That shift matters for this article. A public-health approach asks what sits upstream of violence. It does not wait until harm has happened and then respond only with enforcement. It asks what can be prevented earlier, before patterns of behaviour become fixed and before young people reach crisis point.
Lead exposure belongs in that upstream conversation. It is not a replacement for the better-known explanations of violence, and it should not be used to minimise poverty, trauma, alcohol or social conditions. But it is a preventable childhood exposure linked with aggression, impulsivity, hyperactivity and poor self-control — exactly the kind of early-life risk factor that a public-health approach should take seriously.
The general lesson is that prevention has to include the conditions children grow up in, including the water they drink. That holds wherever old lead plumbing remains in use, and it does not depend on any claim about the causes of violence in a particular city today.
Scotland’s violence reduction model tells us to look further upstream. The lead evidence tells us that old pipes and plumbing are part of that upstream environment. Whatever weight lead carries in the crime literature, removing it from the drinking-water route is justified on the exposure evidence alone.
From Historical Exposure to Present-Day Pipe Replacement
Treatment Bought Time, but the Pipes Kept the Risk Alive
The Scottish evidence shows that treatment worked. Lime dosing, pH correction and orthophosphate reduced plumbosolvency and lowered lead levels in water across Scottish cities. Blood lead fell when exposure fell. In Glasgow, compliance with the 100 µg/L limit then in force rose from 45% of samples in 1976 to 99% by 1982, and maternal blood lead fell with it.[18][19] Measured against the tighter 10 µg/L guideline adopted later, 17% of households still failed in 1993, against 49% of 1981 samples re-cut on the same basis.[15] That was a real public health success.
But the evidence also shows that treatment did not remove the source. The CREW “Lead free Scotland” report is explicit: orthophosphate dosing can reduce lead leaching, but it is not a lead-free strategy.[2] Homes without lead plumbing consistently had far lower water lead than homes that retained lead pipes or lead-lined tanks. Treatment managed the risk. Replacement addresses the source.
The Modern Water Position
Modern water-sector strategy makes the same point. Lead found at the customer’s tap comes from lead pipes — in the communication pipe, the supply pipe or internal plumbing — not from the treatment works. Orthophosphate dosing provides a protective passivating layer inside pipes, but it does not replace them. That is why long-term lead strategy increasingly points toward pipe replacement.[14] Treatment is a mitigation. Replacement is the durable answer.
The Responsibility Problem
One reason the problem persists is the question of responsibility. The water company is usually responsible for the communication pipe, normally up to the property boundary or outside stop tap. The property owner is usually responsible for the private supply pipe and internal plumbing beyond that point.
That split matters. A water company can replace its side, but if lead remains on the customer side, the drinking-water route still includes lead. Full protection depends on addressing both sides of the supply route.
This is why clear public information is essential. Many homeowners do not know where responsibility changes, what pipe material they have, or how to begin the replacement process. The Scottish experience — where a grant mechanism existed for replacing lead pipes where tests exceeded threshold values — shows that public support and clear guidance can accelerate replacement when the will exists.
Why Older Homes Still Matter
The risk is not evenly distributed. It is more likely in older homes, especially where the incoming supply or internal plumbing has never been modernised. Housing age is not proof of lead pipes, but it is the most consistent first indicator of where checks should begin. In many British cities a large share of homes predate the period when lead pipework was removed from normal use, so that indicator still covers a significant portion of the housing stock.
Old pipework can continue to shape exposure long after public attention has moved on. The families living in older homes today should not have to rely on guesswork.
Conclusion
Lead does not explain Scotland’s violent past on its own. The evidence is too careful, and the history is too complex, for that kind of claim. Poverty, trauma, inequality, alcohol, policing, family instability and neighbourhood conditions all remain central to any serious account of violence.
But the Scottish record is now strong enough to support a more measured and specific conclusion: lead exposure belongs inside that history as a serious, avoidable risk factor. How large a contribution it made cannot be quantified from the Scottish evidence as it stands, and any figure offered would be imported from elsewhere rather than measured here. That it should not be dismissed is a different claim from knowing its size, and only the first is currently supported.
In Edinburgh, higher childhood blood lead was associated with worse behaviour — particularly aggression, anti-social behaviour and hyperactivity. In Glasgow, drinking-water lead was severe and city-wide: in 1976 only 45% of samples complied with the 100 µg/L limit then in force.[18] Lime dosing from 1978 reduced that burden. Re-cut against the later 10 µg/L guideline, 49% of households would have failed in 1981 and 17% in 1993; 13% of infants were still exposed at that threshold in 1993.[15] Treatment reduced exposure. It did not remove the pipes. International research supports the idea that early lead exposure can contribute to later violent offending, particularly through its effects on impulse control, aggression and behaviour. And the timing of Scotland’s violence decline — a national peak of 137 victims in 2004–05, a Glasgow City peak of 34 in 2006–07 on figures published from 2005–06 onward, and a sustained fall thereafter[11,12] — is compatible with a roughly two-decade lag after the major exposure cuts of the 1980s and early 1990s. It is not a single clock: either turning point lies closer to children born after orthophosphate dosing began in 1989 than to the first lime-dosed cohorts of 1978–80, and both coincide equally with petrol-lead reduction and with the founding of the Violence Reduction Unit. No published work separates the four.
The lasting lesson is larger than crime alone. Scotland’s experience shows how old pipes and plumbing can cast a long social shadow: first through exposure, then through effects on child development and behaviour, and finally through risks that can echo across communities for generations.
Even if lead explains only part of Scotland’s violence story, it still represents avoidable harm on a generational scale. Treatment reduced risk, but it did not end the source.
The durable public-health answer remains clear: replace the lead.
Sources
- House of Commons Library. Lead in drinking water. Research Paper 97/65. London: House of Commons Library; 1997.
- Akoumianaki I. Lead in drinking water: public health, mitigation and economic perspectives. CD2016_03. Aberdeen: CREW – Scotland’s Centre of Expertise for Waters; 2017.
- Thomson GOB, Raab GM, Hepburn WS, Hunter R, Fulton M, Laxen DPH. Blood-lead levels and children’s behaviour: results from the Edinburgh Lead Study. J Child Psychol Psychiatry. 1989;30(4):515–28.
- Macintyre C, Fulton M, Hepburn W, Yang S, Raab G, Davis S, et al. Changes in blood lead and water lead in Edinburgh: an eight year follow-up to the Edinburgh lead study. Environ Geochem Health. 1998;20(3):157–67.
- Higney A, Hanley N, Moro M. The impact of lead water pollution on birth outcomes: a natural experiment in Scotland. Environ Resour Econ. 2025;88:3737–64.
- Nevin R. Understanding international crime trends: the legacy of preschool lead exposure. Environ Res. 2007;104(3):315–36.
- Reyes JW. Environmental policy as social policy? The impact of childhood lead exposure on crime. B E J Econ Anal Policy. 2007;7(1):article 51. Also issued as NBER Working Paper 13097, Cambridge (MA): National Bureau of Economic Research; 2007.
- Higney A, Hanley N, Moro M. The lead-crime hypothesis: a meta-analysis. Reg Sci Urban Econ. 2022;97:103826.
- Talayero MJ, Robbins CA, Smith ER, Santos-Burgoa C. The association between lead exposure and crime: a systematic review. PLOS Glob Public Health. 2023;3(8):e0002177.
- Scottish Government. What works to reduce crime? A summary of the evidence. Edinburgh: Scottish Government; 2014.
- Scottish Government. Recorded crime in Scotland: homicide in Scotland. Official statistics. Edinburgh: Scottish Government.
- Scottish Centre for Crime and Justice Research. Policy briefing on violence trends in Scotland. Glasgow: SCCJR; 2024.
- Fraser A, Batchelor S, Whittaker L. Long-run homicide pattern in Scotland and concentration in deprived Glasgow areas. BMC Public Health. 2021;21:1108.
- Thames Water. TMS22 enhancement case: long term water quality strategy — lead. PR24 business plan submission. Reading: Thames Water; 2023.
- Watt GCM, Britton A, Gilmour HG, Moore MR, Murray GD, Robertson SJ. Is lead in tap water still a public health problem? An observational study in Glasgow. BMJ. 1996;313(7063):979–81.
- National Records of Scotland. Mid-year population estimates, Scotland. Edinburgh: National Records of Scotland.
- Feigenbaum JJ, Muller C. Lead exposure and violent crime in the early twentieth century. Explor Econ Hist. 2016;62:51–86. doi:10.1016/j.eeh.2016.03.002
- Moore MR. Influence of acid rain upon water plumbosolvency. Environ Health Perspect. 1985;63:121–6. doi:10.1289/ehp.8563121
- Moore MR, Goldberg A, Fyfe WM, Richards WN. Maternal lead levels after alterations to water supply. Lancet. 1981;2(8239):203–4. doi:10.1016/S0140-6736(81)90384-6
- Department of the Environment. Lead in Drinking Water: A Survey in Great Britain 1975–1976. Pollution Paper No. 12. London: HMSO; 1977. Figures quoted here are as reported by Troesken (2006) and Akoumianaki (2017); the original pamphlet has not been consulted directly, and published summaries differ over whether the Scottish total above 50 µg/L is 33% or 34.4%, and the English figure 7.8% or 10%, depending on sampling basis and whether Wales is included.
- Richards WN, Britton A, Cochrane A. Reducing plumbosolvency: the effect of added lime on the Loch Katrine supply to Glasgow. J Inst Water Eng Sci. 1980;34:315–33.
- Stretesky PB, Lynch MJ. The relationship between lead and crime. J Health Soc Behav. 2004;45(2):214–29.
Disclosure
This article is published by London & Surrey Water Services Ltd, a CIPHE member and WaterSafe registered contractor whose business includes lead pipe replacement. The company therefore has a commercial interest in the subject matter. The article is restricted to findings and positions reported in the sources cited, and no claim is made here that is not traceable to those sources. It is not medical advice. Readers concerned about lead exposure should speak to their GP, and readers concerned about lead in their own water supply should contact their water supplier or seek independent laboratory testing.