

The scale of drinking water lead exposure in Scotland
For much of the twentieth century, lead in Scotland was not a rare hazard hidden in a few unusual homes. It was part of everyday domestic life.
It was in old service pipes, household plumbing, and lead-lined cisterns that fed water to older properties. Families drank from it, cooked with it, and raised children around it, often without knowing that the water coming through the tap could be carrying a toxic metal. Scotland’s soft, acidic water made matters worse, because it was especially effective at dissolving lead out of plumbing and into drinking water.
The scale of the problem was enormous, and it was measured. The Department of the Environment surveyed lead in drinking water across Great Britain in 1975–76. In Scotland, 21% of households had random daytime water lead at or above 100 µg/L. The equivalent figures for England and Wales were 2.6% and 2.3%.[2] A further 13.4% of Scottish households fell between 50 and 100 µg/L, against 5.2% in England and 6.5% in Wales.[2] Taken together, more than a third of Scottish households had water lead above 50 µg/L.
That is close to an eightfold gap between Scotland and England at the higher concentration. It was not a marginal issue. It was a national exposure problem shaped by old housing, legacy plumbing and water chemistry.
The survey also showed where the risk sat. The highest concentrations were found in homes with lead pipes only, and in homes where lead and copper pipework had been joined together.[2] The material carrying the water was the thing that mattered.
Nor did the problem disappear quickly. As many as 60,000 lead-lined water storage tanks were still thought to be in use, concentrated in the Edinburgh and Glasgow areas.[1] In the homes linked to the Edinburgh work, privately rented properties were far more likely than public housing to have cold water supplied from a lead tank, and newer homes were far less likely than older homes to contain them.[5]
That is the world the Edinburgh Lead Study stepped into. It did not treat lead as an abstract chemical problem. It asked what this everyday exposure might be doing to children.
Table of Contents
Why Edinburgh mattered
Edinburgh brought together many of the features that made lead exposure in Scotland so serious: older housing, surviving lead plumbing, lead-lined tanks, and a wider Scottish water environment in which acidity was a factor.
The researchers did not sample the city at random. They recruited from schools in a defined area of central Edinburgh, chosen specifically to include older houses, some of which still retained their original lead plumbing.[5] That matters for reading the results correctly. This was a study designed to find children who were actually exposed.
What made it important is that it moved the conversation beyond pipes and chemistry to a harder question: what was this level of exposure doing to Scotland’s children?
The original Edinburgh Lead Study
Venous blood samples were taken from 855 children across 18 primary schools and assayed for lead.[6] From those, a sub-sample of 501 children aged 6 to 9 was selected for the main study.
That selection was deliberate and it is worth stating plainly. The sub-sample comprised the top quartile of the blood-lead distribution, plus roughly one in three of the remaining children.[5] It was weighted towards higher exposure by design.
Within that sub-sample, mean blood lead was 10.4 µg/dL.[6] That figure describes the study group, not the average Edinburgh child.
Behaviour was assessed using the Rutter behaviour scales, completed by both teachers and parents, alongside an extensive home interview. The study controlled for 30 potential confounding variables, including social background, parental test scores, birthweight, family structure and features of the home environment.[6]
One detail cuts off an objection before it can be raised. These were not deprived households. Among the participating families, 43% were in social class I or II, 85% were owner-occupiers, and the researchers recorded that the housing was not of poor quality.[6] Whatever the study found, it did not find it in the poorest homes in the city.
What the study found about child behaviour
The key finding was simple and unsettling: higher blood lead was associated with worse behaviour.
The strongest signal came from teacher ratings. After adjustment for all 30 confounders, blood lead was significantly associated with:
- total behaviour problems (coefficient 0.69, p = 0.005)
- aggressive and anti-social behaviour (1.08, p = 0.004)
- hyperactivity (0.66, p = 0.02)[6]
There was no significant association with the neurotic sub-score (0.19, p = 0.28), which covered more anxious or withdrawn behaviours.[6]
That detail matters. The clearest effects were not general distress. They were the problems that show up in classrooms and daily life: impulsivity, disruptive behaviour, difficulty regulating emotions, trouble sustaining attention.
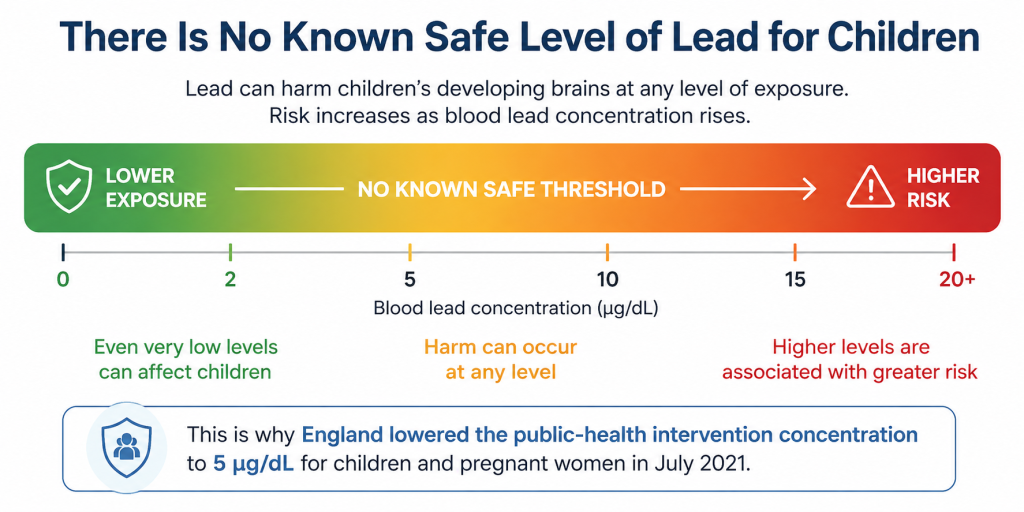
The shape of the relationship mattered too. The researchers found a dose–response pattern with no evidence of a threshold — no reassuring level below which lead stopped mattering.
The size of the effect was meaningful without being sensational. For children in the highest blood-lead group, the odds of falling into a worse behaviour category were 2.4 times those of a child at the sample average, adjusted for all other covariates.[6]
The authors were careful about one thing, and so should we be. Looking at the dose–response plot, they noted that the relationship appeared to be driven largely by the highest-exposure group. The linear trend held, but it was not evenly distributed across the range.
The study also found limited evidence that boys were more affected than girls, particularly in the behaviours linked to aggression and hyperactivity.[6]
Why teachers' ratings mattered
One of the most interesting aspects of the study was the gap between teacher and parent reports. Teachers’ ratings showed a clear relationship with blood lead. Parents’ ratings pointed in the same direction but did not reach statistical significance.
That makes sense on reflection. Teachers observe children in structured settings, against a broad peer group, day after day. They are well placed to notice when a child is more impulsive, more restless, or less able to regulate behaviour than others of the same age. Parents are observing in a different context, with different expectations and few points of comparison. The researchers made exactly this argument.[6]
The difference does not weaken the study. It suggests the effects of lead were showing up where children’s behaviour is most visible and most consequential: in school.
The eight-year follow-up
Before turning to the follow-up, one objection deserves a direct answer. Could the relationship run the other way — could difficult, impulsive children be doing things that raise their own lead levels, rather than lead affecting behaviour?
The authors raised this themselves and gave a specific reply. Reverse causation is a weaker explanation where exposure comes through water than where it comes through dust or soil. A child can increase their exposure by playing outdoors or being careless about hygiene. A child cannot increase the lead concentration in the water coming out of the kitchen tap.[6]
For anyone concerned with lead pipes specifically, that is the study’s own authors narrowing the alternative explanations.
The follow-up returned to the original cohort roughly eight years later. Of 223 eligible families, 207 agreed to take part[4] — a 93% response. A half-hour stagnation sample of cold kitchen water was taken from each household, and 171 young people, then aged 14 to 17, gave a blood sample.
By then, Edinburgh’s water treatment had changed, and some homes had changed their plumbing. The researchers wanted to know what had happened to household water lead, to blood lead, and to the relationship between the two.
Over those eight years, average blood lead fell from 11.0 µg/dL to 4.0 µg/dL[4] — a reduction of around 64%.
What changed in the water
Edinburgh was supplied by two treatment plants running different programmes.
At the first, lime and orthophosphate were both introduced between the original study and the follow-up. Mean household water lead there fell from 34.0 µg/L to 4.3 µg/L, a reduction of 87%.[4]
At the second, lime treatment had already begun before the original study, with orthophosphate added later. Mean water lead fell from 9.3 µg/L to 3.6 µg/L, a reduction of 61%.[4]
Those are not small improvements. They represent a major reduction in exposure — and the researchers attributed them to two things working together: better water treatment, and the removal of lead plumbing.
What the follow-up established about water treatment
The follow-up shows clearly that treatment worked. Both supply areas recorded large falls, including the area where lime dosing had already been in place before the first study and orthophosphate was added afterwards.
That is a real public health lesson. System-wide intervention can reduce exposure across a whole supply area, without waiting for every individual home to be upgraded.
What the study does not do is separate treatment from plumbing replacement and credit the improvement to one alone. The reductions came from both.
What the follow-up established about lead replacement
The comparison between homes is where the follow-up is most useful.
Homes with no lead plumbing had water lead levels:
- 89% lower than homes with lead-lined tanks
- 47% lower than homes with lead pipes[4]
The regulatory consequence was stark. Around one-third of households that still had lead tanks were predicted to exceed the then-current 50 µg/L standard. Among all remaining households, the figure was 3% or lower.[4]
One in three against three in a hundred. The difference was not the treatment. The difference was whether lead was still in contact with the water.
Looking ahead to a possible 10 µg/L standard, the researchers estimated that 34% of households in the first supply area and 25% in the second would still breach it.[4]
That is the practical lesson:
Water treatment can suppress the problem. Replacing lead plumbing removes the source.
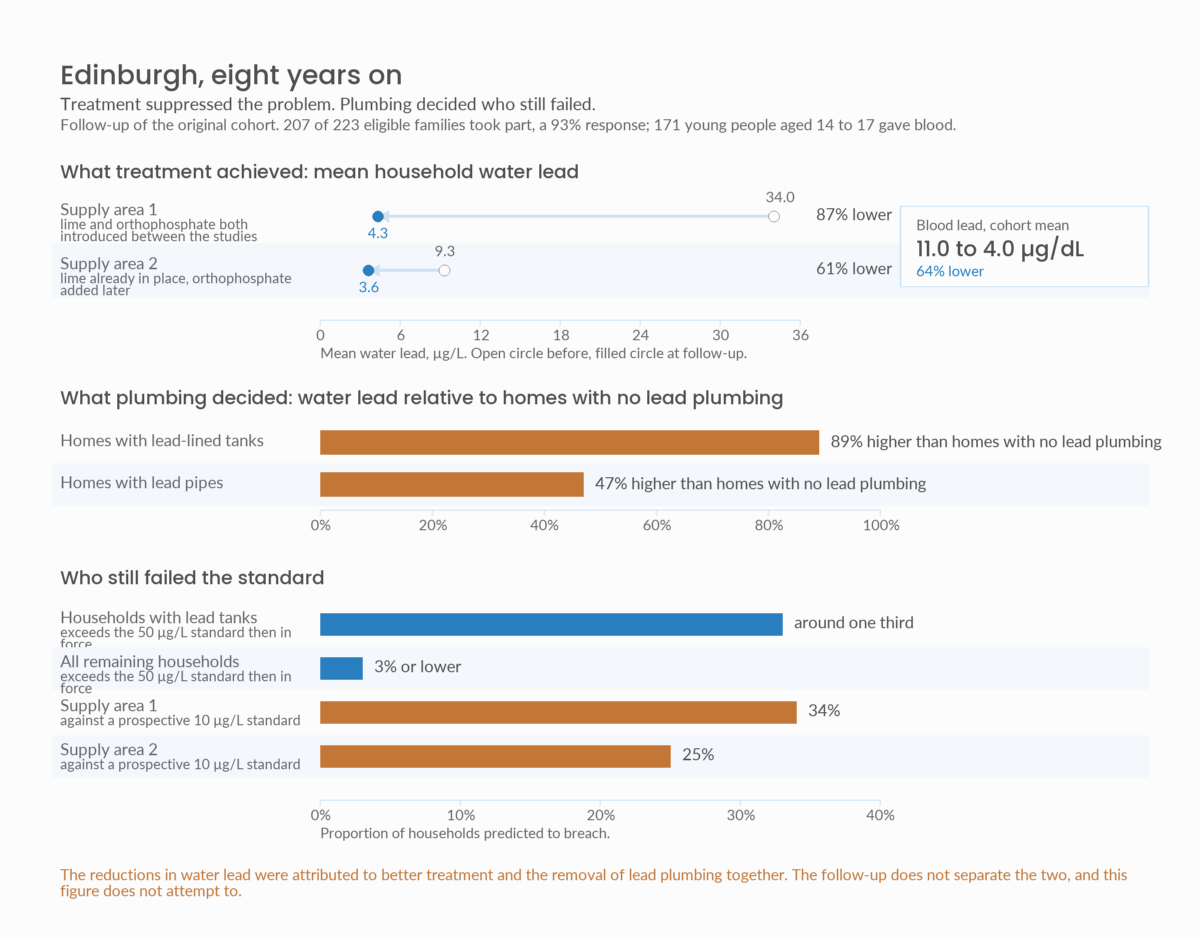
Figure 1. One in three lead-tank households against three in a hundred of the rest. The difference was not the treatment, which both supply areas received. The difference was whether lead remained in contact with the water. Treatment can suppress the problem across a whole supply area without waiting for every home to be upgraded. Replacing the plumbing removes the source.
What the Edinburgh studies taught us
Taken together, the original study and its follow-up established four things.
First, lead exposure in ordinary domestic settings was associated with children’s behaviour — particularly hyperactivity, aggression and anti-social behaviour — after extensive adjustment for social and family circumstances.
Second, there was no clear safe threshold in the behavioural data. The idea that low-to-moderate exposure could simply be ignored became much harder to defend.
Third, water treatment works. It reduced household water lead substantially and blood lead fell alongside it.
Fourth, and most important in practice, treatment is not the same as removal. Treatment makes the water less aggressive and reduces how much lead dissolves into it. It buys time and delivers real public health gains. Replacing the pipe removes the source from the property.
Conclusion
The Edinburgh Lead Study was a landmark because it showed that lead in water was not only a plumbing problem or a water chemistry problem. It was a child development problem.
The authors’ own conclusion was measured, and it is worth keeping their framing rather than overstating it: lead at low levels of exposure probably has a small but harmful effect on children’s behaviour, and whether or not that risk is minimal, it is an avoidable one.[6]
Avoidable is the operative word. Where lead pipes and lead-lined tanks remain, the problem has not been removed — only managed.
References
- Akoumianaki I. Lead in drinking water: public health, mitigation and economic perspectives. CD2016_03. Aberdeen: CREW – Scotland’s Centre of Expertise for Waters; 2017.
- Department of the Environment. Lead in drinking water: a survey of Great Britain 1975–1976. Pollution Paper No. 12. London: HMSO; 1977. Survey figures cited here as reported in Akoumianaki 2017.
- Fulton M, Raab GM, Thomson GOB, Laxen DPH, Hunter R, Hepburn W. Influence of blood lead on the ability and attainment of children in Edinburgh. Lancet. 1987;1(8544):1221–6.
- Macintyre C, Fulton M, Hepburn W, Yang S, Raab G, Davis S, et al. Changes in blood lead and water lead in Edinburgh: an eight year follow-up to the Edinburgh lead study. Environ Geochem Health. 1998;20(3):157–67.
- Raab GM, Fulton M, Laxen DPH, Thomson GOB. The Edinburgh Lead Study: aspects of design and progress. Statistician. 1985;34:45–57.
- Thomson GOB, Raab GM, Hepburn WS, Hunter R, Fulton M, Laxen DPH. Blood-lead levels and children’s behaviour: results from the Edinburgh Lead Study. J Child Psychol Psychiatry. 1989;30(4):515–28.
Disclosure
This article is published by London & Surrey Water Services Ltd, a CIPHE member and WaterSafe registered contractor whose business includes lead pipe replacement. The company therefore has a commercial interest in the subject matter. The article is restricted to findings and positions reported in the sources cited, and no claim is made here that is not traceable to those sources. It is not medical advice. Readers concerned about lead exposure should speak to their GP, and readers concerned about lead in their own water supply should contact their water supplier or seek independent laboratory testing.