Introduction: When Lead Exposure Shows Up at School
Something important about lead exposure is that it rarely announces itself. Children do not collapse or turn visibly ill. The effects can unfold slowly, often invisibly, through the developing brain — and may only become legible years later, when a child sits down at a school desk.
That delayed visibility is one of the reasons a British study from the 1990s remains so consequential. When researchers measured blood lead levels in young children living in south-west England and then followed those children into primary school, they found something that should not be surprising but still is: children with higher blood lead at 30 months of age were more likely to struggle with reading and writing by ages 7 to 8.
The association was visible at levels below the older 10 µg/dL threshold that shaped clinical concern for many years. In plain language, the study found that children with blood lead levels between 5 and 10 µg/dL were linked with reading outcomes 49% lower and writing outcomes 51% lower than children in the lowest blood lead group.
That matters because these were not children selected because of an acute poisoning incident. They were part of a major UK birth cohort.
This article follows the evidence from the laboratory to the classroom to the kitchen tap, and ends, as it has to, somewhere closer to home.
Table of Contents
What Was Children of the 90s?
The Avon Longitudinal Study of Parents and Children — usually called ALSPAC, or “Children of the 90s” — is one of the most significant birth cohort studies ever conducted in the United Kingdom.
It began by recruiting pregnant women living in the former county of Avon in south-west England whose babies were expected between April 1991 and December 1992. By the time the study was fully enrolled, it encompassed 14,541 pregnancies, producing 14,062 live births and 13,988 children who were alive at the end of their first year.
What makes ALSPAC unusual is the depth and duration of what it followed. Participants were not surveyed once or twice; they were tracked across childhood, adolescence and into adult life. Researchers collected biological samples, administered repeated questionnaires, ran clinic assessments, accessed educational records and, where possible, followed participants into their adult years.
That richness of data means findings from ALSPAC carry a weight that single-point studies rarely can.
For the lead research discussed here, one specific design element is particularly important: a randomly selected “Children in Focus” subgroup attended research clinics during early childhood. It was from this subgroup that the children’s blood lead measurements were taken.
Why This Study Was Different
Before discussing what the study found, it is worth pausing on why this particular evidence matters more than generic statements about lead and child development.
A great deal of the existing literature on childhood lead exposure comes from the United States, from populations with histories of widespread industrial or paint-related exposure, or from settings where blood lead levels were considerably higher than those seen in contemporary British children. Those studies are scientifically important, but they are not always straightforward to translate into UK public-health terms.
ALSPAC was different in several respects.
It was prospective: researchers measured blood lead first and then waited for developmental outcomes, rather than looking back and trying to reconstruct past exposure.
It used venous blood samples rather than capillary, or fingerprick, samples. Venous samples are less vulnerable to skin contamination and are generally considered more reliable for this kind of measurement.
It was conducted in a UK population, in the early 1990s, at a time when blood lead levels had already fallen substantially following the removal of lead from petrol in the preceding decade.
And crucially, it linked early blood lead measurements to real educational outcomes — national test scores at ages 7 to 8 — rather than only to laboratory cognition measures conducted in controlled clinical settings.
That combination of features makes ALSPAC’s lead findings unusually useful for writing about public health in England. This is not extrapolated evidence from another country. These are British children, measured carefully, followed into British schools.
Blood Lead at 30 Months: The Key Measurement
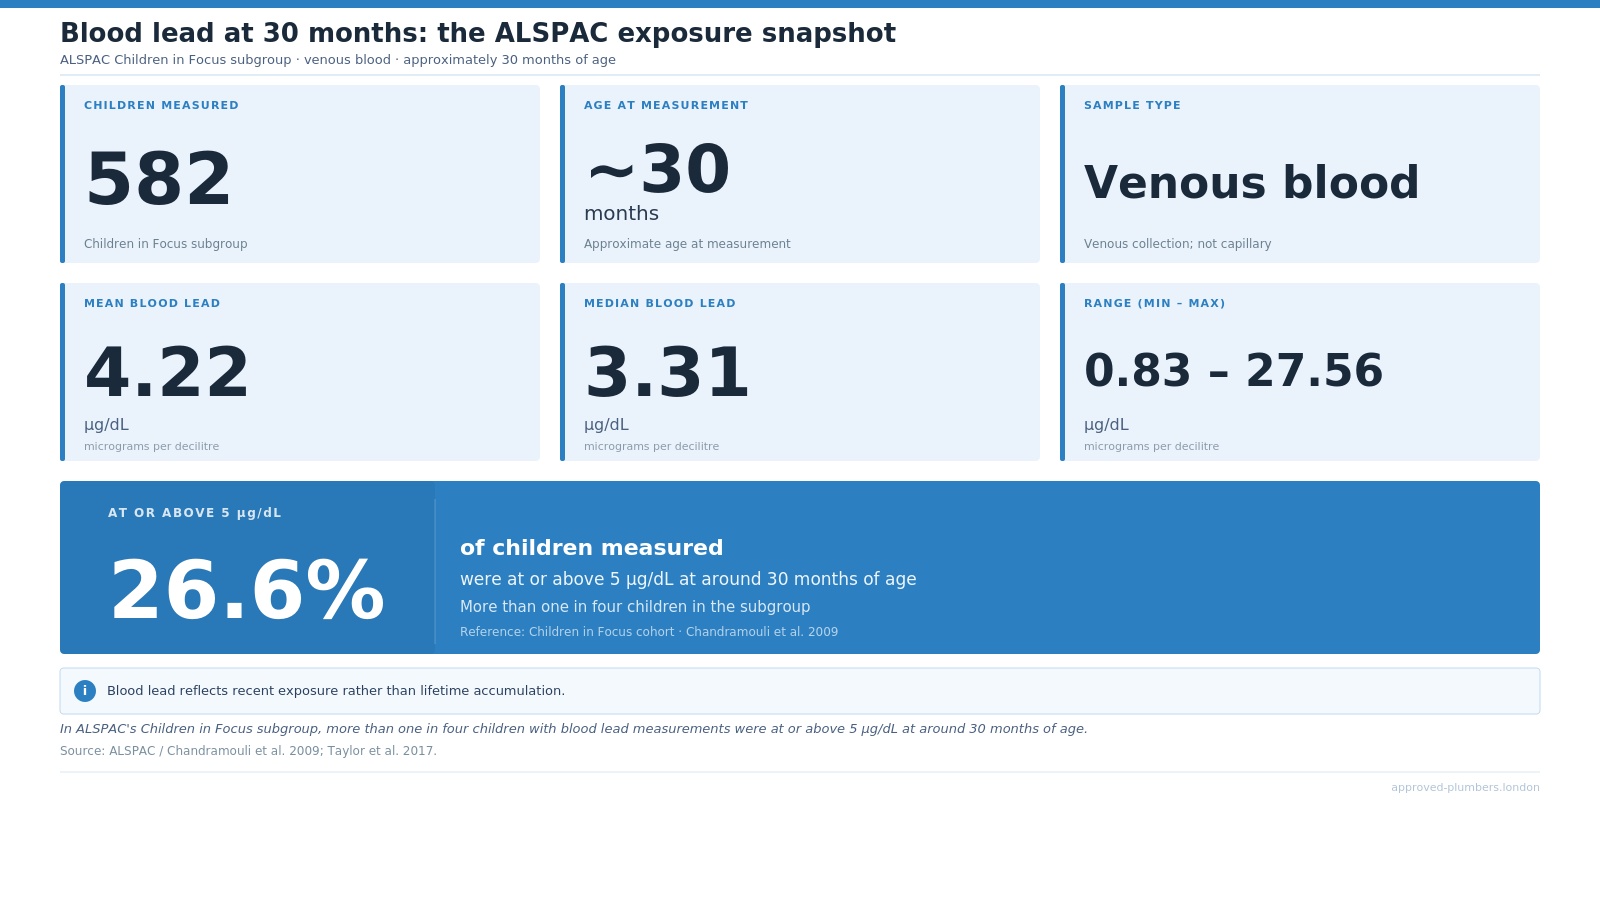
In the Children in Focus subgroup, venous blood lead was measured at approximately 30 months of age using atomic absorption spectrometry, a precise analytical technique. The sample that produced usable measurements comprised 582 children.
The descriptive statistics from that sample are worth understanding in their own right, because they situate the study’s findings in the real exposure landscape of early-1990s England.
The mean blood lead concentration was 4.22 µg/dL, with a standard deviation of 3.12 µg/dL. The median was 3.31 µg/dL. The range ran from 0.83 µg/dL at the low end to 27.56 µg/dL at the high end.
And 26.6% of the 582 children — more than one in four — had blood lead levels at or above 5 µg/dL.
To understand why that last figure matters, it helps to know that 5 µg/dL is now the level at which UK public-health guidance recommends intervention. More on that shift shortly. The point here is that, in this cohort of ordinary British children in the early 1990s — not children recruited because of a known industrial incident or acute poisoning event — more than a quarter had blood lead levels at or above what we now treat as the threshold for public-health action.
Blood lead concentrations reflect recent exposure rather than lifetime accumulation. The half-life of lead in blood is measured in weeks. So these measurements capture what the children had been exposed to in the period before their 30-month clinic visit, through whatever combination of sources — dust, soil, water, food, paint, household materials or other environmental sources — was relevant to their particular home and surroundings.
That is one reason the findings remain important. The study was not just asking whether very high lead exposure was harmful. It was asking whether levels below the older “safe” or concern threshold were still visible later in a child’s development.
Reading and Writing: Where Low-Level Lead Exposure Became Visible
The study that examined what those blood lead measurements predicted was published in 2009 in the Archives of Disease in Childhood. Its authors were Chandramouli, Steer, Ellis and Emond, working within ALSPAC’s research structure. Their paper examined outcomes at ages 7 to 8: national Standard Assessment Tests in reading, writing and spelling, alongside behavioural measures completed by parents and teachers.
Of the 582 children with blood lead data, 488 — 84% — had complete data on confounders and outcomes, which is a strong completion rate for a longitudinal study of this kind.
The analysis adjusted for a detailed set of potential confounders, including the child’s gender and IQ, maternal education and smoking, paternal socioeconomic status during pregnancy, home ownership, home facilities, family adversity and parenting attitudes.
The reading and writing findings were the central result.
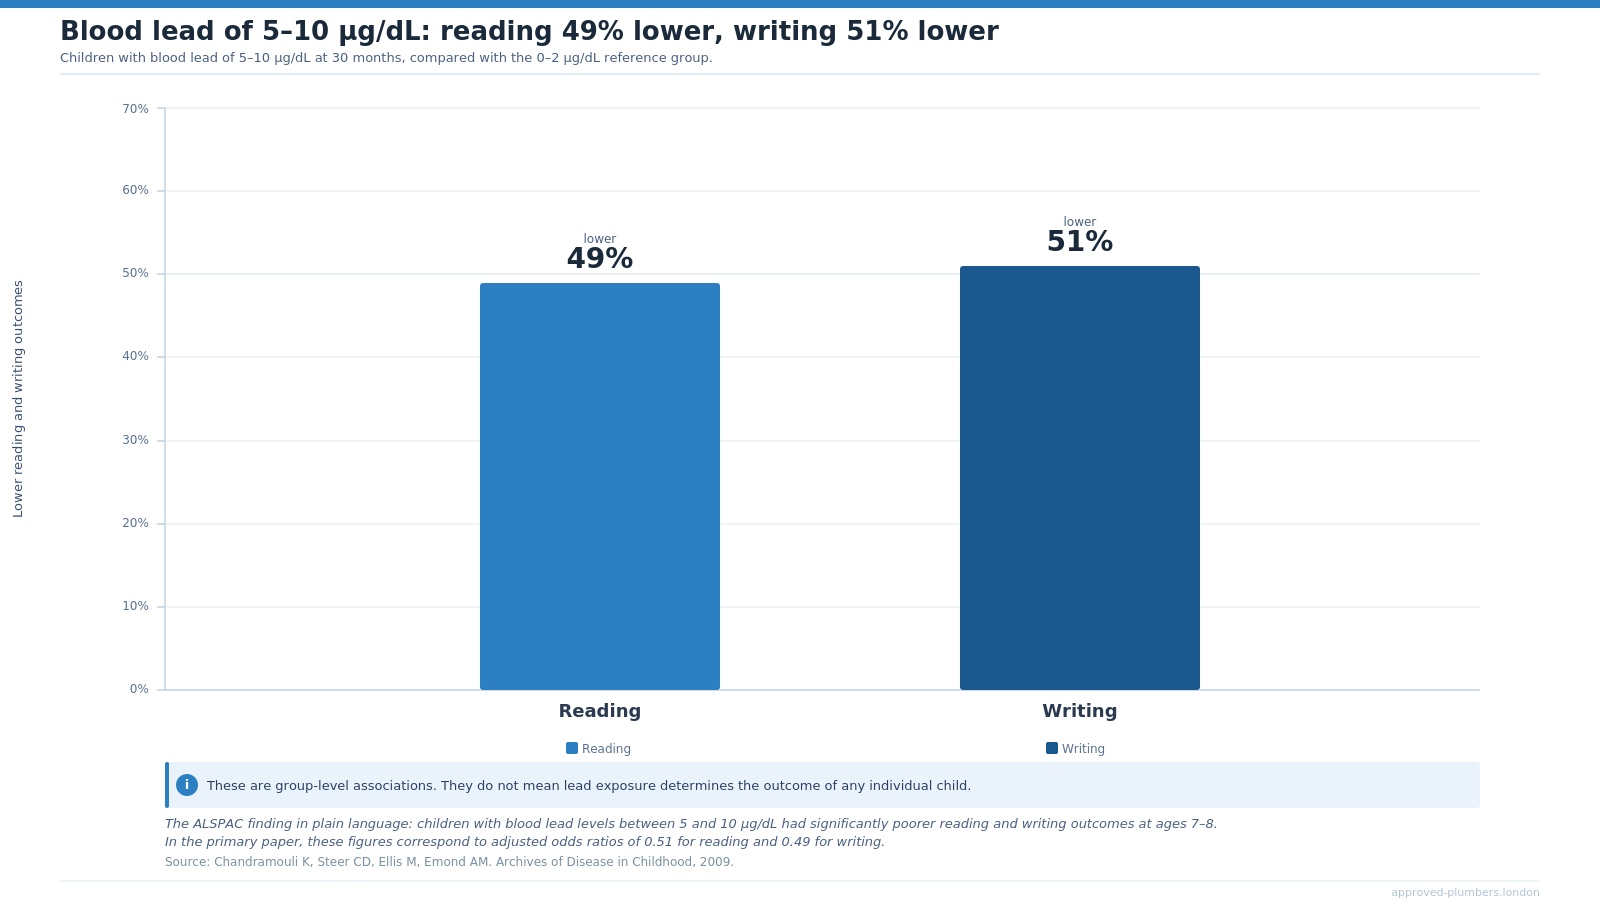
In the primary paper, those figures correspond to adjusted odds ratios of 0.51 for reading and 0.49 for writing, using children with blood lead of 0 to 2 µg/dL as the reference group. The figures describe group-level associations, not certainty about any individual child. They do not mean that lead exposure determines a child’s reading or writing outcome on its own.
But they do make the public-health point clearly: blood lead levels below the older 10 µg/dL concern threshold were still linked with measurable differences in school performance.
The study found no clear effect at levels up to 5 µg/dL in that specific analysis. But between 5 and 10 µg/dL — still below the older threshold — the association with reading and writing became much harder to dismiss.
At blood lead levels above 10 µg/dL, writing remained adversely associated. The reading estimate was also in the adverse direction, but less precise, partly because the number of children in that higher category was smaller.
The paper’s conclusion was direct: these data supported reducing the threshold for clinical concern from 10 µg/dL to 5 µg/dL.
School Performance Beyond the Headline
The reading and writing findings are the clearest part of the story because they are concrete. Parents understand reading. Teachers understand writing. A child struggling with literacy is not an abstract public-health endpoint.
But the study also produced a continuous dose-response analysis worth noting, because it shows that the relationship between blood lead and school performance was not simply an on/off switch.
Across the full sample, using a log dose-response model, a doubling in blood lead concentration was associated with a 0.3-point decline in SAT grades, with a 95% confidence interval of −0.5 to −0.1.
Considered in isolation, that may sound modest. Applied across a population of children whose blood lead had never prompted clinical attention, it is not.
Spelling is sometimes mentioned alongside reading and writing in summaries of this work, and the study did find spelling significant in the overall log dose-response model. But the categorical estimates — which are more specific and harder to misread — were weaker, with wider confidence intervals that crossed 1 in the 5 to 10 µg/dL group.
The most defensible claim from this study prioritises reading and writing. Spelling is a supporting note, not a headline of equal strength.
That distinction matters. The strongest ALSPAC story is not a vague claim that lead harmed “school performance” in every possible way. It is more precise than that: early-childhood blood lead was associated with later reading and writing outcomes, with behavioural findings sitting alongside that educational pattern.
Behaviour: Hyperactivity and Antisocial Behaviour
The Chandramouli study also examined behaviour using both parent-rated and teacher-rated instruments. The findings are important, but they need to be presented carefully rather than as a blanket result, because the pattern differs meaningfully by who did the rating.
Teacher-rated outcomes were more consistently associated with higher blood lead levels than parent-rated ones.
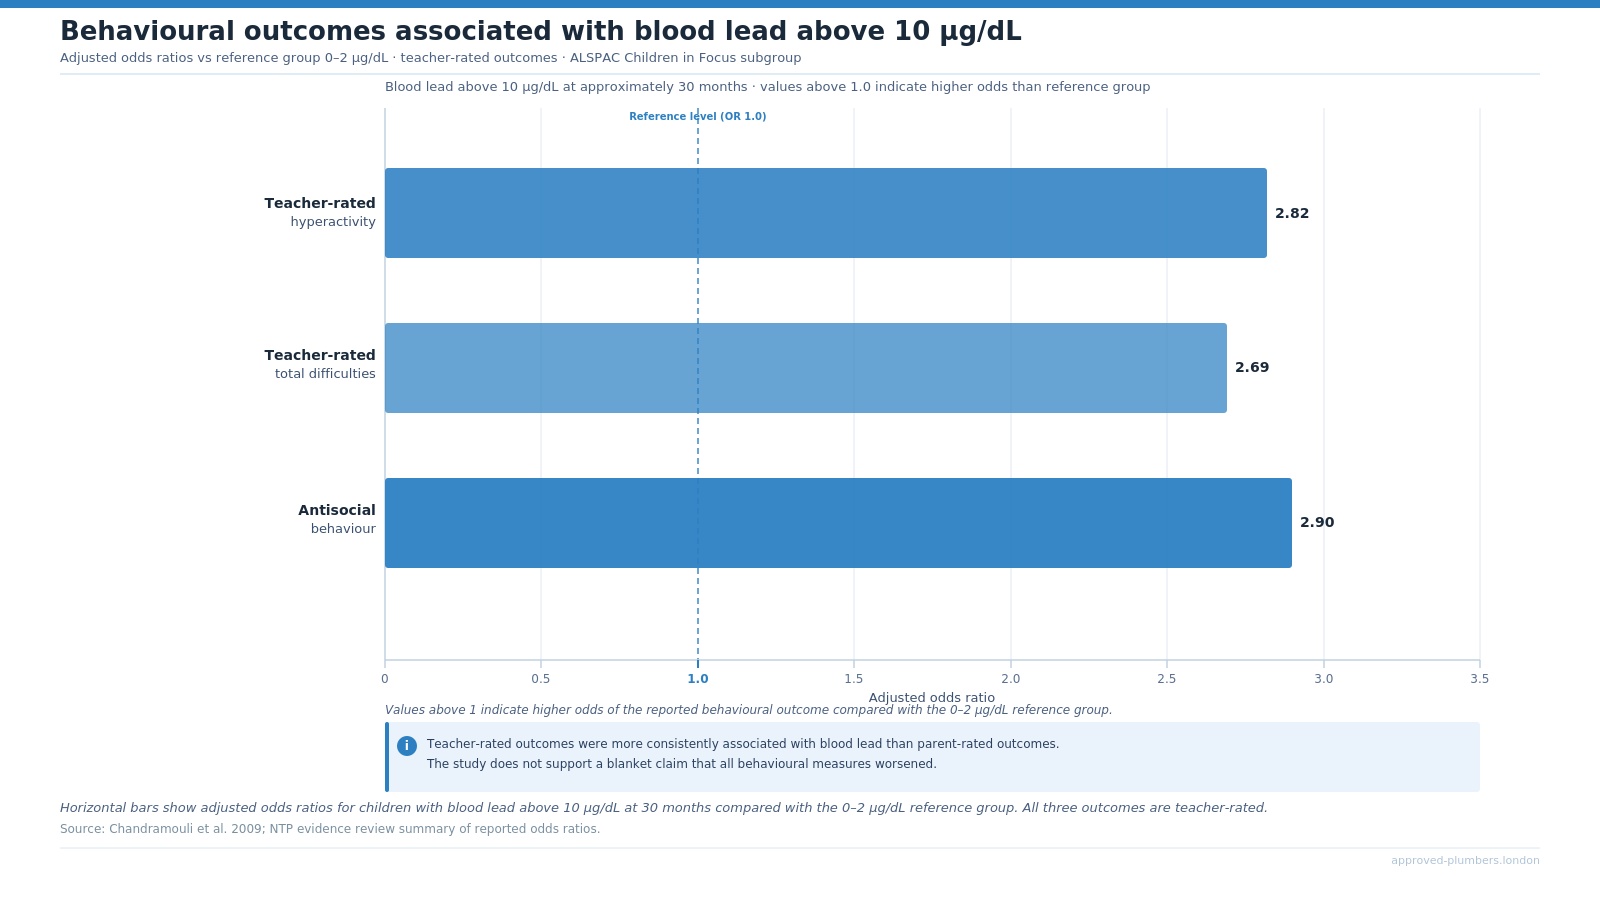
For children with blood lead above 10 µg/dL, compared with the reference group at 0 to 2 µg/dL, the reported associations were substantial:
- Teacher-rated hyperactivity: adjusted odds ratio 2.82
- Teacher-rated total difficulties: adjusted odds ratio 2.69
- Antisocial behaviour: adjusted odds ratio 2.90
Put plainly, children in this higher blood lead category were almost three times as likely to show teacher-rated hyperactivity or antisocial behaviour compared with children in the lowest blood lead group.
Again, this is not a claim about destiny. It does not mean that every child with elevated blood lead will develop behavioural problems, or that lead is the only explanation for any particular child’s behaviour. But it does show that, at group level, higher early-childhood blood lead was associated with later behavioural patterns that teachers could observe in school.
Parent-rated hyperactivity and parent-rated total difficulties were not statistically significant in the categorical results. That is a meaningful distinction. The study does not support a claim that every aspect of child behaviour worsened proportionally with blood lead.
It supports a more specific claim: children with blood lead above 10 µg/dL at 30 months showed significantly elevated rates of teacher-rated hyperactivity, total difficulties and antisocial behaviour by school age.
Attention task performance was more mixed. Measures from the Test of Everyday Attention for Children, including selective and dual attention, were not clearly associated with blood lead in the categorical analysis. That suggests a specific pattern of vulnerability — in literacy and in behaviours visible in a classroom setting — rather than a uniform effect across all cognitive domains.
The robust public-health story is about reading, writing, antisocial behaviour and teacher-rated hyperactivity. It is not a sweeping claim about every aspect of cognition or behaviour
IQ: What ALSPAC Found — and What It Did Not
One of the most common claims about lead and child development is that it lowers IQ. It is a claim with genuine scientific support from multiple large studies. But the ALSPAC evidence on IQ is more complicated, and any article drawing on this cohort needs to reflect that honestly.
The principal ALSPAC paper on IQ focused on prenatal exposure: maternal blood lead measured during pregnancy, and child IQ assessed at ages 4 and 8 using established intelligence batteries.
The findings in adjusted models were largely null. The paper found no adverse association between prenatal blood lead and child IQ at either age, and no evidence that prenatal blood lead moderated the relationship between child blood lead and IQ.
The authors explicitly noted that maternal education was the strongest variable in attenuating the crude associations. In other words, when socioeconomic and educational factors were properly accounted for, the apparent lead-IQ relationship largely disappeared in this particular ALSPAC analysis.
A sex-specific finding did emerge. Among girls at age 8, there appeared to be a positive association between prenatal blood lead and IQ — roughly +0.7 IQ points per 1 µg/dL increase in prenatal blood lead — while the corresponding coefficient in boys tended to be negative.
That pattern does not run in the expected toxicological direction, and the authors treated it cautiously. It is not the kind of finding that should anchor a public-health article.
None of this means ALSPAC says lead is harmless. What it means is that ALSPAC cannot responsibly be summarised as “the British study that proved lead lowers IQ.”
Its own IQ findings are more mixed and more confounded than that framing implies. What ALSPAC did show, powerfully and with well-controlled analysis, is that early-childhood blood lead was associated with later educational attainment and specific behavioural outcomes.
That is a strong finding. Enlarging it to encompass IQ more broadly than the evidence supports would weaken the credibility of the whole article.
Maternal Blood Lead: Important, But Not the Main Story
The ALSPAC study also measured maternal blood lead during pregnancy. Whole blood samples were collected at a median gestational age of 11 weeks from 4,285 pregnant women and analysed by inductively coupled plasma dynamic reaction cell mass spectrometry.
The mean concentration was 3.67 µg/dL. The median was 3.41 µg/dL. And 14.3% had concentrations at or above 5 µg/dL.
These measurements produced two informative sets of findings.
First, they identified predictors of elevated maternal blood lead. Some of the strongest predictors were modifiable behaviours: cigarette smoking, alcohol intake and coffee consumption were all associated with higher maternal blood lead. Women who had lived in Avon all their lives had lower levels than those who had arrived more recently. Women of Indian, Pakistani and Bangladeshi ethnicity had higher levels than White women.
Second, the maternal blood lead data were linked to birth outcomes. Women with blood lead at or above 5 µg/dL had a significantly increased risk of preterm delivery, with an adjusted odds ratio of 2.00. Increasing maternal blood lead was also associated with reductions in birthweight, alongside small reductions in head circumference and crown-heel length.
These are important findings. For a reader who is pregnant or planning a pregnancy, they are directly relevant.
But they are context for this article’s central argument rather than its engine.
The more resonant sequence for a general audience runs: child blood lead at 30 months → later reading, writing and behavioural outcomes → what that means for prevention today.
It is also worth noting that blood lead in pregnancy and blood lead in the child at 30 months were positively correlated, but only moderately so. The reported Pearson correlation was 0.280.
The two exposure windows are not interchangeable. A child whose mother had elevated blood lead during pregnancy is not necessarily the same child who will have elevated blood lead at 30 months. The correlation is real, but not strong enough to treat prenatal and early-childhood exposure as a single phenomenon.
Why the 5 µg/dL Line Matters
The Children of the 90s findings matter because they sat below the older 10 µg/dL level that had shaped clinical concern for many years.
Chandramouli and colleagues concluded in 2009 that their data supported reducing the threshold for clinical concern from 10 µg/dL to 5 µg/dL. In later UK public-health guidance, the intervention concentration for children moved to 5 µg/dL.
That change is more significant than it might initially appear, and it needs to be explained carefully.
Lowering the intervention concentration from 10 to 5 µg/dL does not mean that blood lead below 5 µg/dL is safe. It does not mean that children below that level can be told their development is unaffected by lead exposure.
What it means is that scientific understanding of harm had shifted. The evidence base, including studies like ALSPAC, had accumulated to the point where the previous 10 µg/dL threshold could no longer be treated as a sensible line below which clinical and public-health attention was unnecessary.
The World Health Organisation’s position is blunter than intervention-threshold language suggests: there is no known safe blood lead concentration in children. Its current lead-poisoning fact sheet notes that even blood lead concentrations as low as 3.5 µg/dL may be associated with decreased intelligence, behavioural difficulties and learning problems.
The CDC uses 3.5 µg/dL as its blood lead reference value for children. That reference value is not a “safe” level; it is a public-health tool used to identify children with higher blood lead than most children and to guide follow-up.
Current UK public-health guidance and Lead Exposure in Children Surveillance System reporting use the same basic framing: lead can be harmful even at low concentrations, and there is no known safe level of exposure for children.
Lower limits do not make lead safe. They reflect a better understanding that harm occurs at lower levels than previously recognised.
Why Drinking Water Still Belongs in This Conversation
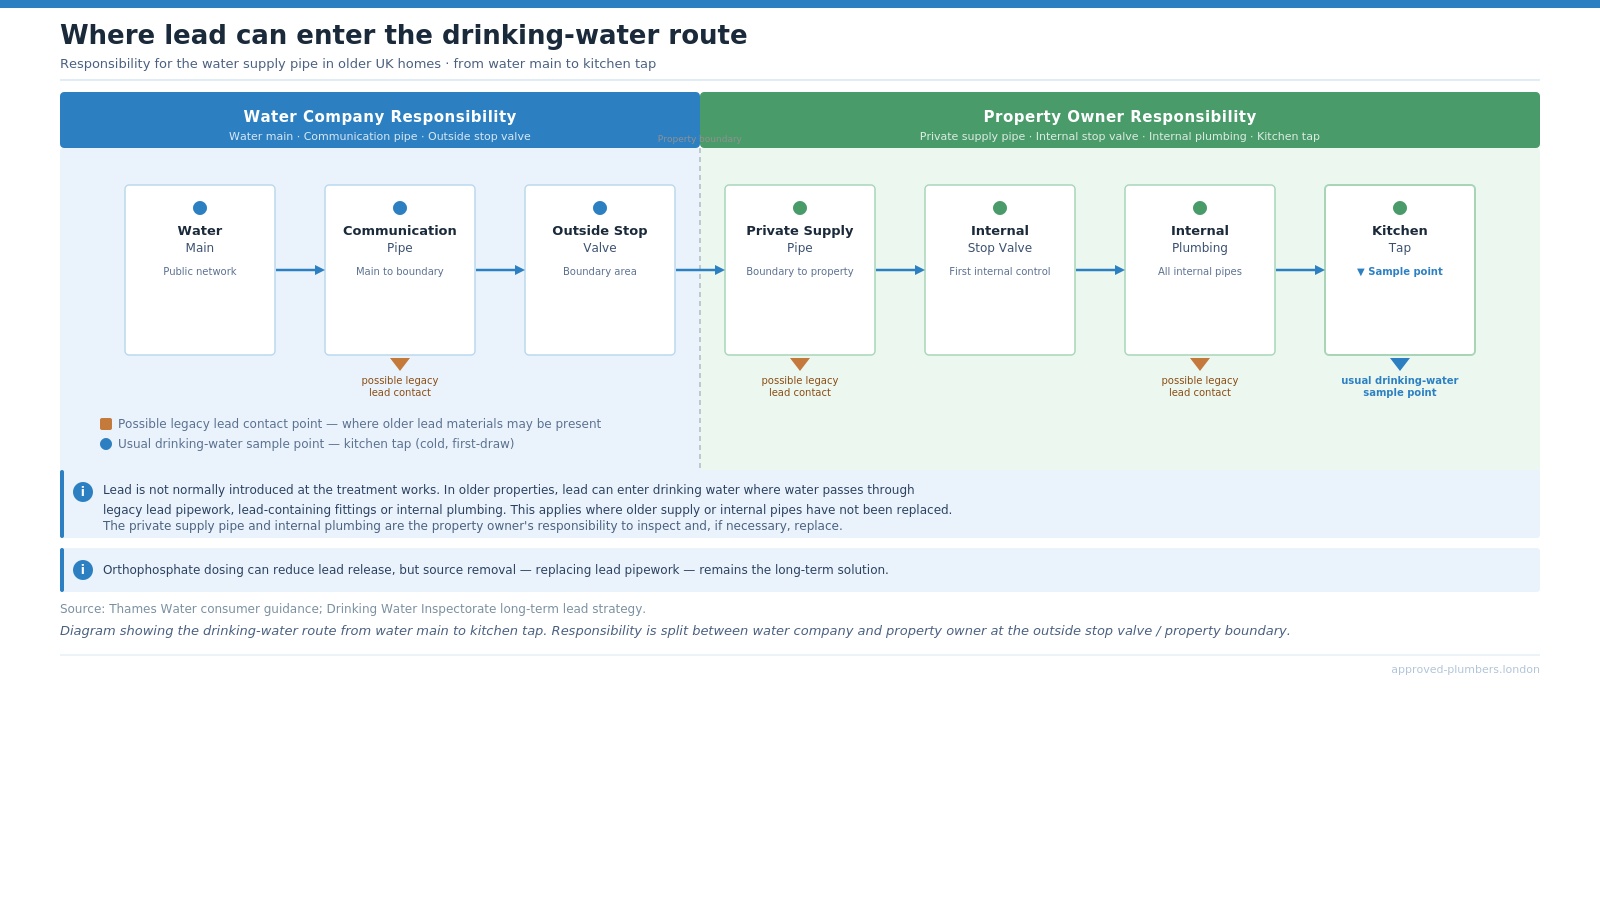
Lead does not arrive in your tap water from the treatment works. Thames Water states that its water mains are not made of lead and that there is virtually no lead in the water leaving its treatment facilities.
The lead risk in drinking water comes from elsewhere in the system: service pipes, shared supply lines and internal plumbing in older properties where lead materials were used as standard.
Small amounts of lead can dissolve into water that sits in contact with lead-bearing surfaces — a process called plumbosolvency — and that dissolution is affected by standing time, temperature, water pH and water chemistry.
In practice, this means lead risk has to be considered along the whole drinking-water path from main to tap: the communication pipe, the private supply pipe, the internal stop valve, internal plumbing and finally the kitchen tap.
A single compliant sample at network level does not necessarily answer every question about the plumbing materials inside or immediately serving a specific property.
Thames Water, in common with most English water suppliers, currently adds orthophosphate to most of its supply. Orthophosphate helps form a thin protective coating on the inner surface of lead pipes that reduces the rate at which lead dissolves. It is a meaningful risk-reduction measure.
But it is not the same as removing the source of lead, and it does not achieve the same outcome. It is an interim measure, not a final answer.
The Drinking Water Inspectorate is unambiguous about the long-term position. In its strategy document on reducing lead exposure from drinking water, the DWI states that toxicological evidence indicates no lower threshold for adverse effects of lead on health. It states that current company strategies — pH adjustment and orthophosphate dosing — have reduced breaches of lead standards but are unlikely ever to achieve full compliance with current or future lower standards.
The DWI’s conclusion is clear: the long-term solution is to remove contact between lead pipework and drinking water by replacing or lining lead service pipes.
There is a structural complication worth understanding. The service pipe between the water main in the street and the property boundary is the responsibility of the water company. The remainder of the connection — from the boundary into and through the property — belongs to the property owner.
That split ownership is one of the practical reasons legacy lead remains in service. Even if a water company replaces its section of the supply, the customer-side pipe and internal plumbing may remain in place untouched.
Thames Water’s TMS22 lead enhancement case sets out a programme to replace up to 54,000 lead communication pipes in the 2025–2030 period, alongside a customer trial looking at ways to support replacement of customer-side lead supply pipework.
That programme is real and ongoing. But it covers only part of the problem, and the customer-side section remains the responsibility — and the choice — of the individual property owner.
Why This Matters in Older London Homes
Housing age is not a guarantee. Saying a property was built before 1970 is not the same as saying it has lead pipes.
Materials were used inconsistently across different boroughs, builders and property types. Renovations have replaced some original plumbing over the intervening decades. And there is no public register that reliably identifies which individual properties retain lead service connections or internal lead plumbing.
But housing age is a reasonable proxy, and in London it is a proxy that applies at very large scale.
London contains an unusually high proportion of older housing stock. Victorian, Edwardian and inter-war properties are not exceptions here. In large parts of the inner city and many outer boroughs, they are the dominant type.
Thames Water’s public guidance states that properties built before 1970 may have lead pipes. UK public-health surveillance has also identified older housing, including terraced houses and properties built before the 1970s, as a relevant risk factor when investigating elevated blood lead concentrations in children.
A London home can be in full regulatory compliance — with water leaving the treatment works at legally permissible lead concentrations — and still carry a property-specific lead exposure path if lead pipework or internal plumbing remains between the main and the kitchen tap.
Orthophosphate dosing reduces that risk. Hard water reduces plumbosolvency relative to soft water. But neither is the same as source removal, and the DWI does not treat either as a substitute for it. The framework in current UK policy is source identification and source removal, not passive reassurance based on regional water chemistry.
One claim worth resisting is that lead pipes are only risky when disturbed.
Thames Water’s own guidance notes that disturbing lead pipes — through renovation, drilling or pipe work — can increase lead release into water. That is true and worth knowing. But it does not follow that undisturbed lead pipes are risk-free.
Water that sits in contact with an undisturbed lead pipe can still absorb lead. The risk during active disturbance may be higher; the baseline risk from passive contact is not zero.
What Homeowners Should Do Next
The appropriate response to what the evidence shows is not panic. It is identification and action, where action is possible
If you live in a property built before 1970 — especially a terraced property, especially in an area of London with dense older housing stock — it is reasonable to find out whether you have a lead service pipe and whether internal plumbing contains lead.
Start with the drinking-water path from the main to the tap. Lead risk depends on what water comes into contact with before it reaches the kitchen tap. That means the communication pipe, the private supply pipe, the internal stop valve and the internal plumbing all matter.
Check with your water company. Thames Water can provide information about the communication pipe — the section between the street main and your property boundary — and whether it is known to be lead. They will not necessarily hold information about internal plumbing, which is your responsibility to investigate.
Inspect your supply pipe and internal pipework. Lead pipes have a distinctive appearance: dull grey, slightly soft to the touch, and when scratched lightly reveal shiny silver metal beneath. They are typically 15–25mm in diameter and, because they were shaped by hand rather than machined, often curve gently rather than running in straight lines.
Consider water testing where appropriate. Water testing can help identify whether lead is being detected at the tap. The most informative samples are often taken after water has stood in the pipes for several hours, rather than after running the tap, because standing water better reflects what may be dissolving from contact surfaces.
Do not rely on boiling. Boiling removes biological contamination. It does not remove lead. As water evaporates during boiling, lead concentration in the remaining water can actually increase. Boiling is not a lead-mitigation strategy for plumbing-related exposure.
Consider filtration only as an interim measure. Certain independently certified filters can reduce lead in drinking water if installed and maintained correctly, but filtration should be treated as temporary risk reduction rather than a substitute for removing lead pipework.
Replace lead pipework where possible. This is the long-term answer. Partial replacement carries a specific risk: if a water company replaces the communication pipe but internal lead plumbing remains, the benefit may be limited, because water can pick up lead from any contact surface along its path.
If you replace your private supply pipe or internal pipework, confirm how that work relates to the water company’s section — and vice versa.
If you have young children and are concerned, speak to your GP. Blood lead testing is available through NHS pathways. A venous blood lead result gives the clearest available picture of what is actually being absorbed.
If you live in an older London property and are unsure what your incoming supply pipe is made from, a lead pipe inspection can confirm the material and help you understand whether replacement is needed
Final Thought
The Children of the 90s study is now more than three decades old in its data. The children whose blood was measured at 30 months are in their mid-thirties today. But what that study found still shapes how childhood lead exposure should be understood.
The finding was not dramatic in the way acute poisoning is dramatic. There were no medical emergencies, no visible symptoms, no single smoking gun.
There were children at blood lead levels that their parents and doctors had no reason to flag as a major concern — who, a few years later, were more likely to be reading below expected levels, writing below expected levels, or being reported by teachers as hyperactive or engaging in antisocial behaviour.
The lead did not make itself known at the time. It made itself known at school.
The practical implication is the same one that the Drinking Water Inspectorate has reached from its own regulatory direction: identification and source removal, not indefinite reliance on mitigation strategies that reduce risk without eliminating it.
Phosphate dosing is useful. Testing is useful. Awareness is useful. None of those is a substitute for replacing a lead pipe.
In an older London home, asking whether lead pipework is present is not alarmism. It is the right question.
The children who attended those ALSPAC clinics in the early 1990s did not have the benefit of a lowered intervention threshold, better-understood plumbosolvency risk, improved surveillance or regulatory replacement programmes.
Children living in older homes today have the benefit of all that knowledge — but only if the question gets asked, and only if the answer leads somewhere.
Sources
Chandramouli K, Steer CD, Ellis M, Emond AM. Effects of early childhood lead exposure on academic performance and behaviour of school age children. Archives of Disease in Childhood. 2009;94(11):844–848.
Taylor CM et al. Effects of low-level prenatal lead exposure on child IQ at 4 and 8 years in a UK birth cohort study. NeuroToxicology. 2017.
Taylor CM, Golding J, Emond AM. Adverse effects of maternal lead levels on birth outcomes in the ALSPAC study: a prospective birth cohort study. BJOG. 2015.
World Health Organisation. Lead poisoning fact sheet.
CDC. Update of the Blood Lead Reference Value — United States, 2021.
UK public-health lead exposure guidance and Lead Exposure in Children Surveillance System annual reports.
Drinking Water Inspectorate. Long-term Strategies to Reduce Lead Exposure from Drinking Water.
Thames Water. TMS22 Enhancement Case: Long Term Water Quality Strategy Lead.
Thames Water lead consumer guidance.