
Abstract
A laboratory can determine the concentration of lead in a water sample with high precision. It cannot determine what that concentration represents. This review examines the sampling variables that govern what a lead result is evidence of, and argues that an analytical value cannot be interpreted independently of the protocol that produced it.
Lead concentration at a tap is not a fixed property of a building. It varies with the time water has stood in contact with plumbing materials, the volume collected, the rate at which it is drawn, previous patterns of water use, and the hydraulic position of the sampled water within the system. Controlled studies report differences by factors of approximately five to nine at the same sampling point under differing patterns of use, with larger excursions where particulate lead is mobilised. Experimental findings from one plumbing system transfer to others as principles rather than as values, because water chemistry, corrosion scale, configuration, occupancy and temperature all differ between properties.
Four distinct purposes are identified: regulatory compliance, household exposure assessment, source identification, and post-intervention verification. Each requires different evidence, and no single protocol serves all four. Random daytime sampling — one litre taken at the consumer’s tap without prior flushing — is prescribed for compliance monitoring throughout the United Kingdom, and performs that function well. It was not designed to locate a lead source, estimate long-term exposure, or verify remedial work, and criticisms arising from its use for those purposes mistake the question it was built to answer.
For the remaining three purposes, no equivalent nationally prescribed protocol has been identified in England and Wales. Such investigations are routinely undertaken, but by methods selected according to the circumstances of each case. The regulatory framework itself distinguishes measurement from diagnosis: an exceedance triggers an investigation rather than concluding one.
The practical implication is a reordering of the question. Before asking what the lead concentration is, the prior question is what the sampling protocol was designed to establish. Only then can the result be interpreted. The review closes by placing sampling within water safety planning, where it functions as a verification step rather than as the starting point of a risk assessment. A dedicated section examines sampling in public health investigations triggered by an elevated blood lead concentration, where published guidance in Scotland sets out sampling methods against the questions they answer, while the equivalent English procedure is referenced but not published.
Table of Contents
Introduction — There Is No Such Thing as Simply “a Lead Test”
A laboratory report states:
Lead: 8 µg/L
At first sight, the result appears straightforward. The concentration is below the current drinking water standard of 10 µg/L applied in England and Wales, and it may therefore appear reassuring. Yet from a scientific perspective, the analytical result alone tells us remarkably little. Eight micrograms per litre in what water?
Was the sample collected as the first 125 mL after overnight stagnation? Was it the first litre drawn during normal daytime use? Was it collected after the tap had been flushed? Was it part of a sequential sampling profile? Had the water remained stagnant for two hours or sixteen? Was the sample collected gently, or at a high flow rate capable of mobilising particulate lead? Did it represent water that had been standing within the tap itself, the internal plumbing, a private supply pipe or a lead communication pipe?
Each of these questions may influence the measured concentration without altering the analytical accuracy of the laboratory result.
This distinction lies at the heart of lead sampling in drinking water. Modern analytical laboratories are capable of measuring lead concentrations with exceptional precision at concentrations well below the regulatory standard. The uncertainty lies not in the analytical chemistry but in the interpretation of the sample. A laboratory measures the concentration of lead contained within the submitted bottle. It cannot determine, from the concentration alone, how representative that water is of the plumbing system, the occupants’ exposure, the location of the lead source or the effectiveness of a remedial intervention.
The widespread use of the phrase “a lead test” implies that there is a single recognised procedure capable of answering every important question about lead in drinking water. The scientific literature suggests otherwise. Different sampling protocols have been developed for different purposes, each controlling or accepting different sampling variables and each producing evidence appropriate to a particular question. A result obtained using one protocol should not automatically be interpreted as though it had been obtained using another.
The variables influencing a lead result are well established. Contact time affects the dissolution of lead into stagnant water. Sample volume determines how much of the plumbing system contributes to the bottle. Flow rate can influence the mobilisation of particulate lead. Previous water use alters the hydraulic position of water throughout the system, while the position of the sample within the draw determines which hydraulic volumes are ultimately analysed. Together, these variables explain why two samples collected from the same tap may legitimately produce different lead concentrations despite both being analytically correct.
The distinction is recognised implicitly within the regulatory framework. In England and Wales, compliance monitoring is undertaken using prescribed sampling arrangements designed to determine whether the statutory lead standard has been exceeded. Where that monitoring identifies a breach, however, the regulatory process does not end with the analytical result. It proceeds to investigation in order to establish the cause and determine appropriate remedial action. The compliance sample demonstrates that a problem exists; it does not, by itself, diagnose why it exists.
The point is recognised internationally. The World Health Organization cautions that lead limits set in different countries cannot be compared directly, because their interpretation depends on the sampling regime — which the regulation itself may not even specify [24].
This article examines the scientific principles that underpin lead content sampling in drinking water. Drawing upon experimental research, regulatory guidance and field investigations, it considers how stagnation, sample volume, flow rate, previous water use and hydraulic position influence measured lead concentrations. It then examines the principal sampling protocols currently in use and the different questions they are designed to answer.
The central argument is straightforward.
A lead concentration is a measurement of a particular sample. The sampling protocol determines what that result is evidence of. The chain from question to interpretation is set out in Figure 1.
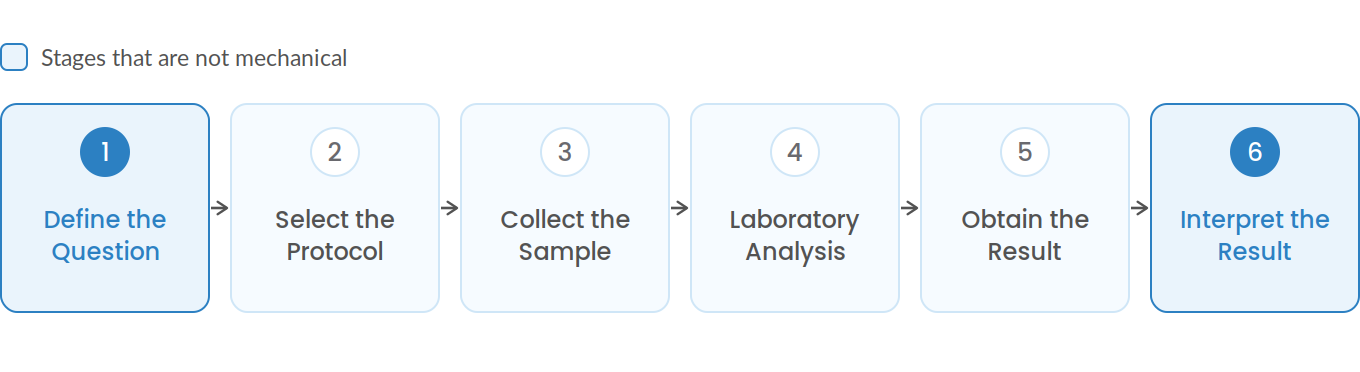
The chain from question to interpretation. The two stages shown in blue are the only ones that are not mechanical.
The Laboratory Measures the Bottle
Every laboratory analysis begins with a simple analytical question:
How much lead is present in the submitted water sample?
Modern analytical laboratories can determine lead concentrations at extremely low levels with remarkable accuracy and precision. Using validated analytical techniques and rigorous quality assurance procedures, they are capable of measuring the concentration of lead contained within a water sample to within a few micrograms per litre or less. Assuming the sample has been collected, preserved and transported correctly, the laboratory result accurately describes the concentration of lead in the bottle that arrived for analysis.
That statement is both precise and important. The laboratory measures the water contained within the submitted sample. It does not measure the plumbing system. This distinction is fundamental to understanding every lead result. The laboratory has no direct knowledge of where the sampled water originated, how long it had been standing, what materials it had been in contact with, or why the sample was collected. Those factors are established before the bottle ever reaches the laboratory and lie entirely outside the analytical process.
A laboratory cannot determine from the measured concentration alone:
- how long the sampled water had remained stagnant;
- whether it originated from the tap body, a branch pipe, internal plumbing, a private supply pipe or a communication pipe;
- whether the sample contained predominantly dissolved lead or particulate lead;
- whether the water had been flushed immediately before sampling;
- whether the result represents normal consumer exposure or an intentionally controlled sampling condition;
- whether the sample was collected for regulatory compliance, diagnostic investigation or verification following remedial work.
Those questions cannot be answered by chemical analysis because they are not properties of the water itself. They are properties of the sampling protocol.
This distinction is often overlooked. Laboratory reports are frequently interpreted as though the reported concentration were an intrinsic property of the property itself, leading to statements such as “the house has 8 µg/L of lead” or “the property’s lead level is 12 µg/L”. Scientifically, such statements are incomplete. A building does not possess a single fixed lead concentration. The reported value describes only the water contained within the submitted sample, collected under one particular set of conditions at one particular moment in time.
An analogy can be drawn with medical testing. A laboratory can accurately measure the glucose concentration in a blood sample. Whether that result represents a fasting blood glucose, a post-prandial measurement or the response to a glucose tolerance test depends entirely upon how and when the sample was collected. The analytical chemistry is identical; the interpretation is not. The laboratory measures the sample, while the clinical protocol determines what the result means.
Exactly the same principle applies to lead in drinking water. A reported concentration of 8 µg/L may be analytically correct in every respect, yet its significance depends entirely upon the circumstances in which the sample was obtained. The same concentration could represent a one-litre Random Daytime compliance sample collected during normal household use, the first 125 mL following overnight stagnation, a flushed sample collected after several litres had been discharged, or one aliquot within a sequential sampling profile. Although the analytical result is identical, each sample answers a different scientific question.
Consequently, the analytical result should never be interpreted independently of the sampling protocol. The concentration reported by the laboratory is only one part of the evidence. Equally important is understanding what water entered the bottle in the first place.
Recognising this distinction resolves many of the apparent inconsistencies found in lead sampling. Different samples collected from the same tap may produce different lead concentrations without implying analytical error or poor laboratory performance. If the samples represent different hydraulic volumes, different stagnation periods or different flow conditions, they are not analysing the same water and should not be expected to produce identical results.
The laboratory, therefore, provides an answer to one specific question:
How much lead was present in the submitted sample?
The broader questions—whether the result represents regulatory compliance, household exposure, the presence of lead pipework, the location of the lead source or the success of a remedial intervention—can only be answered by understanding the sampling protocol that produced the sample. This distinction provides the foundation for the remainder of this article. Before considering individual sampling methods, it is first necessary to understand why lead concentration at a tap is not a fixed property, but the product of continually changing physical and chemical processes within the plumbing system. That is the subject of the next section.
Lead at the Tap Is Not a Fixed Concentration
One of the most common misconceptions surrounding lead in drinking water is that a property possesses a single, fixed “lead level”. Laboratory reports are often interpreted as though they describe an inherent characteristic of the building, in much the same way as an address or a floor area. The scientific evidence does not support this interpretation.
Lead concentration at a tap is not a constant property of the plumbing system. It is a dynamic measurement that changes with time, water use and hydraulic conditions. The concentration measured at any given moment reflects the history of the water contained within the sample bottle rather than a permanent characteristic of the property itself.
Understanding this distinction is fundamental because it explains why repeat samples collected from the same tap can legitimately produce different analytical results without implying laboratory error, inconsistent plumbing or contradictory evidence. The water itself has changed.
The magnitude of that variation is not trivial. Controlled investigation of a lead service line under varying patterns of use and stagnation reported differences in measured lead concentration by factors of approximately five to nine at the same sampling point [9]. Episodic mobilisation of particulate lead may produce further, larger excursions. A property therefore does not have a lead concentration in any stable sense; it has a range of possible concentrations determined by the conditions under which water is drawn.
Four interacting processes are primarily responsible for this variability: the dissolution of lead into water, the mobilisation of particulate lead, the geometry of the plumbing system, and the way water is used within the building.
Dissolved Lead
Lead enters drinking water principally while water remains in contact with lead-containing materials. Where lead pipes, lead-containing solder, brass fittings or other lead-bearing components are present, small quantities of lead may dissolve into the water during periods of stagnation.
This is a chemical process. As contact time increases, dissolved lead generally increases until the water approaches equilibrium with the pipe surface. The rate of increase is influenced by water chemistry, corrosion control, temperature and the condition of the pipe, but under otherwise similar conditions the amount of dissolved lead present in the water is closely related to the time the water has remained in contact with the plumbing materials.
Importantly, this process is continuous rather than fixed. Every period of stagnation begins a new cycle of lead release. Water drawn immediately after prolonged non-use is therefore chemically different from water drawn only minutes after the previous use of the tap.
Particulate Lead
Not all lead present in drinking water is dissolved. Lead may also be present as microscopic particles originating from corrosion scales, mineral deposits or fragments of lead-containing materials within the plumbing system. Unlike dissolved lead, which enters solution gradually through chemical processes, particulate lead is often introduced through physical disturbance.
Changes in water flow, pressure fluctuations, plumbing work or disturbance of corrosion deposits may release particles into the flowing water, producing short-term increases in measured lead concentration that are independent of stagnation time. These particulate events are often intermittent and can contribute substantially to the variability observed between apparently similar samples.
The distinction between dissolved and particulate lead is therefore critical. Although both contribute to the total lead concentration reported by the laboratory, they arise through different mechanisms and do not necessarily respond in the same way to changes in sampling conditions.
Plumbing Geometry
Water standing within a plumbing system is not contained within a single uniform reservoir. It occupies a complex network of pipes, fittings, valves, meters and outlets, each with its own internal volume and construction materials. Water contained within the tap body may have been in contact primarily with brass components. Water standing within an internal branch pipe may have experienced different conditions, while water further upstream may have remained within a private supply pipe or a lead communication pipe. These hydraulic volumes are physically separate before the tap is opened.
When water begins to flow, these separate volumes do not arrive at the outlet simultaneously. They are displaced progressively as water moves through the plumbing system. Consequently, the composition of the sampled water depends not only upon its chemistry but also upon where that water was located immediately before sampling began.
Two samples collected from the same tap may therefore represent different parts of the plumbing system simply because different volumes of water entered the sample bottle.
Water Use
Every use of a tap changes the hydraulic condition of the plumbing system. Running a kitchen tap, flushing a toilet, operating a washing machine or taking a shower all move water through different parts of the internal plumbing. In buildings with shared supplies or complex plumbing arrangements, water used elsewhere within the property—or even within neighbouring properties—may alter which water subsequently occupies particular sections of pipework.
Consequently, the stated stagnation period at one outlet does not necessarily describe the history of every part of the plumbing system. Water nearest the tap may have remained undisturbed for several hours while water elsewhere within the system has been displaced much more recently. This explains why apparently identical sampling conditions may nevertheless produce different lead concentrations. The water entering the sample bottle may have followed a different hydraulic history before the sample was taken.
A Dynamic System
These four processes operate simultaneously.
Lead dissolves into stagnant water over time. Particulate lead may be mobilised by hydraulic disturbance. Different parts of the plumbing system contribute different volumes of water, and every use of the plumbing changes where that water is positioned before the next sample is collected. The concentration measured at the tap is therefore the outcome of a continuously changing physical and chemical system rather than a fixed property of the building.
Recognising this dynamic behaviour provides the foundation for understanding why sampling protocols differ. If lead concentration changes according to contact time, hydraulic volume and water movement, then the way a sample is collected inevitably determines what the laboratory result represents. The next section examines these sampling variables individually and shows how they define the evidence contained within every lead sample.
The Variables That Define a Lead Sample
The previous section established that lead concentration at the tap is not a fixed property of a building but the outcome of continuously changing chemical and hydraulic processes. The next question is therefore straightforward:
What determines which water enters the sample bottle?
Although lead sampling protocols vary considerably, almost every sample can be described by three primary variables:
- contact time;
- sample volume; and
- flow rate.
Together, these variables determine the chemical and physical characteristics of the water presented to the laboratory. They define the sample itself and, consequently, what the analytical result can legitimately be interpreted to mean. Two further variables—previous water use and the position of the sample within the draw—modify how these three principal variables behave in real plumbing systems. They do not replace the primary variables but explain why apparently identical sampling protocols may still produce different results. The five are shown together in Figure 2.
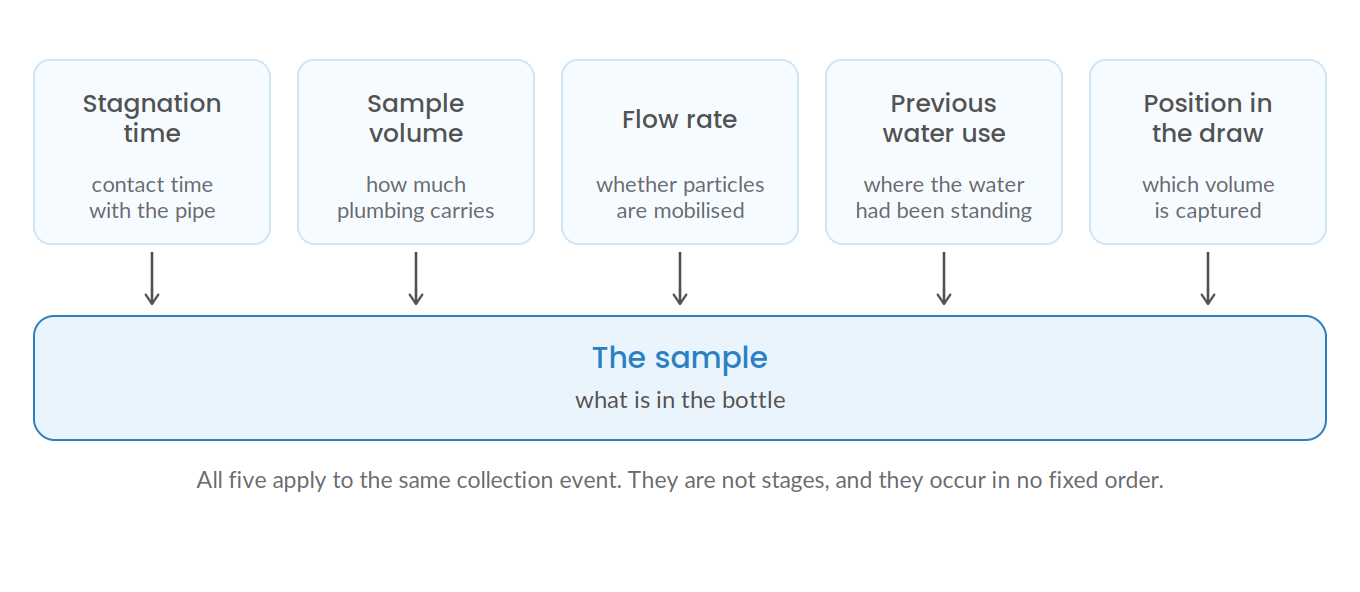
The five variables that define a lead sample. Each is a property of how the sample was collected rather than of the building, and each can alter the measured concentration without affecting the accuracy of the analysis.
Understanding these variables is essential because every recognised lead-sampling protocol, whether Random Daytime Sampling, first-draw sampling, flushed sampling or sequential sampling, is fundamentally a different combination of time, volume and flow.
Stagnation Time
Stagnation time describes the period during which water remains in contact with plumbing materials before sampling. This is perhaps the most familiar variable in lead sampling because it directly influences the opportunity for dissolved lead to enter the water. As water stands within lead-containing plumbing, chemical interactions occur between the pipe surface and the water. Under otherwise similar conditions, longer contact generally permits greater lead release, although the relationship is not linear and depends upon the chemistry of both the water and the plumbing materials.
Stagnation time therefore defines the chemical history of the sampled water. Importantly, however, stagnation time is not simply a measure of elapsed hours. It describes the contact history of the particular water entering the sample bottle. Water occupying different parts of the plumbing system may not all have remained stagnant for identical periods, particularly in buildings with complex internal plumbing or variable patterns of water use.
For this reason, stagnation time should be regarded as one of the defining characteristics of the sample rather than merely a descriptive note accompanying the laboratory result.
Sample Volume
Sample volume determines how much of the plumbing system contributes water to the bottle. When a tap is opened, the water nearest the outlet emerges first. As additional water is collected, progressively larger hydraulic volumes are displaced from further upstream within the plumbing system. Consequently, increasing the sample volume changes not only the amount of water collected but also the proportion of the plumbing system represented within the sample.
This distinction is fundamental.
A sample of 125 mL, a sample of one litre and a sample collected after several litres have already been discharged are not simply different quantities of the same water. They may represent entirely different hydraulic regions within the plumbing system. Sample volume therefore defines the spatial extent of the sample.
It answers the question:
How much of the plumbing system contributed to the water that was analysed?
Flow Rate
Flow rate determines how water moves through the plumbing system during sampling. Although often treated as a procedural detail, the rate at which water is drawn can influence both the hydraulic behaviour of the system and the composition of the sample. Under some conditions, higher flow rates may increase the mobilisation of particulate lead by disturbing corrosion deposits or loose material adhering to pipe surfaces. Lower flow rates may produce different hydraulic conditions and therefore different particulate contributions.
Flow rate does not simply describe how quickly the bottle was filled. It defines the hydraulic conditions under which the sample was collected and may therefore influence both the dissolved and particulate fractions of the measured lead concentration. For this reason, flow rate forms the third principal variable defining the sample.
Previous Water Use
The three primary variables do not operate in isolation. Every use of the plumbing system changes the position of water within it. Opening a kitchen tap, flushing a toilet or operating a washing machine alters which hydraulic volumes occupy different sections of the plumbing immediately before the next sample is collected.
Consequently, the stated stagnation period at a particular outlet may not accurately describe the history of every part of the plumbing system. Water nearest the tap may have remained undisturbed while water further upstream has been displaced more recently, or vice versa. Previous water use therefore influences the relationship between stagnation time and the water actually entering the sample bottle.
It is one reason why two apparently identical sampling events may nevertheless produce different analytical results.
Sample Position Within the Draw
The final variable is often overlooked but is central to understanding lead sampling. Every sample occupies a position within the overall draw from the tap. The first 125 mL, the first litre, the third litre and the fifth litre are not interchangeable because they represent different portions of the plumbing system. Water collected later in the draw has travelled from progressively more distant hydraulic volumes and may therefore have experienced different contact histories and different lead sources before reaching the outlet.
This principle underpins sequential sampling and explains why lead concentration may rise, fall or fluctuate as progressively larger volumes of water are discharged. The position of the sample within the draw is therefore part of the evidence. It describes not simply how much water was collected, but when that water reached the sampling bottle.
Time × Volume × Flow
Taken together, stagnation time, sample volume and flow rate define the fundamental characteristics of every lead sample. Time determines the opportunity for lead release. Volume determines which parts of the plumbing system contribute to the sample. Flow determines the hydraulic conditions under which that water reaches the bottle.
Previous water use and the position of the sample within the draw influence how these three variables interact within individual plumbing systems. Every recognised lead-sampling protocol can therefore be understood as a different combination of these variables. The apparent diversity of sampling methods is, in reality, the deliberate manipulation of time, volume and flow to answer different scientific questions.
The following sections examine each of these variables in greater detail, beginning with stagnation—the variable that determines how much lead can enter the water before sampling begins.
Stagnation: The Same Pipe, Different Contact Time, Different Result
Of the three principal variables governing lead sampling, stagnation time has probably received the greatest attention within the scientific literature. The reason is straightforward. Lead does not enter drinking water instantaneously. It is released while water remains in contact with lead-containing materials, making contact time one of the primary determinants of dissolved lead concentration.
At first sight, the relationship appears simple: the longer water stands in a lead pipe, the more lead it contains. The experimental evidence shows that the reality is more nuanced. Lead release is time-dependent but non-linear. Concentrations generally increase with stagnation, but the rate of increase progressively declines as the water approaches chemical equilibrium with the plumbing materials. Lead does not accumulate indefinitely at a constant rate. The process is governed by corrosion chemistry and reaction kinetics rather than by a simple linear relationship between time and concentration.
This distinction is important because it means that apparently similar stagnation periods may represent very different stages of the lead-release process.
What Happens While Water Stands
When water remains stationary within lead-containing plumbing, dissolved lead begins to enter solution through chemical interaction with the pipe surface. Initially, the concentration may increase relatively rapidly because the difference between the lead concentration in the water and the equilibrium concentration at the pipe surface is greatest. As the concentration within the water increases, however, the driving force for further dissolution progressively decreases. The rate of lead release therefore slows, eventually approaching a plateau where relatively little additional dissolved lead enters the water.
This behaviour is characteristic of many corrosion processes and should not be interpreted as evidence that lead release has ceased. Rather, it reflects the tendency of the water to approach chemical equilibrium under the prevailing conditions. The practical consequence is that stagnation time influences not only how much lead enters the water, but also how rapidly that concentration changes.
The Relationship Is Not Linear
The non-linear nature of lead release has been demonstrated repeatedly under controlled experimental conditions.
Lytle and Schock (2000)[8] examined the dissolution of metals from plumbing materials during stagnation and showed that dissolved lead concentrations generally increased as stagnation time increased. Importantly, however, the increase was not constant. The rate of lead release progressively declined with time, producing the characteristic approach towards equilibrium expected from corrosion kinetics rather than continuous linear accumulation. In one of the examples reported, the dissolved lead concentration rose from approximately 0.40 mg/L after six hours to approximately 0.54 mg/L after sixteen hours—an increase of roughly a third across an additional ten hours of contact, rather than the near-tripling that a linear relationship would predict.
Subsequent work by Doré and colleagues extended these observations using harvested full and partially replaced lead service lines under controlled laboratory conditions. Stagnation periods ranging from 30 minutes to 336 hours demonstrated that the largest increases in dissolved lead occurred during the earlier stages of stagnation, after which concentrations increasingly approached a plateau. Approximately half of the overnight concentration was already present after only thirty minutes when compared with a six-hour stagnation. Rates of increase were highest during the first sixteen hours, with the plateau or maximum concentration frequently reached by around that point, although partially replaced configurations sometimes exhibited slower or more variable behaviour.
Further evidence comes from Lytle and colleagues[10] (2021), who investigated lead release from a lead service line under controlled conditions. In the particular system studied, approximately 55% of the eventual equilibrium concentration had already been reached after only two hours of stagnation, with maximum concentrations occurring across a range of approximately 7 to 18.5 hours depending upon the conditions examined. This illustrates how a substantial proportion of dissolved lead release may occur relatively early in the stagnation period.
These studies are highly consistent in their overall conclusions. Longer stagnation generally increases dissolved lead concentration. The increase is greatest during the earlier stages. The rate of increase progressively declines as equilibrium is approached. One qualification must be emphasised. None of these studies establishes a universal stagnation curve. The experimental findings describe the systems investigated rather than providing a single model applicable to every building — a point returned to in section 11.
Why “Overnight” Is Not a Standardised Sampling Condition
This non-linear behaviour has an important practical consequence. Many sampling protocols and public health recommendations refer simply to “overnight stagnation.” At first sight, the phrase appears sufficiently precise to define a sampling condition.
Scientifically, it does not.
An overnight stagnation may represent six hours in one property, eight hours in another, twelve hours in another and sixteen hours elsewhere. These are not equivalent sampling conditions. They represent different points along a non-linear lead-release curve. Where lead release is increasing rapidly during the earlier stages of stagnation, relatively small differences in contact time may produce materially different dissolved lead concentrations. Later in the stagnation period, where the system is approaching equilibrium, similar differences in elapsed time may have comparatively little effect.
Two households may therefore both follow the instruction to collect an “overnight” sample while producing water that has experienced substantially different contact times and different stages of lead-release behaviour. The laboratory result remains analytically correct in each case. The samples are simply not directly comparable.
Stagnation Defines the Chemical History of the Sample
Stagnation time is therefore much more than a procedural detail. It defines the chemical history of the water entering the sample bottle. Together with sample volume and flow rate, it determines what evidence the laboratory result can legitimately provide. Understanding this principle explains why different sampling protocols specify different stagnation conditions—or deliberately avoid specifying them altogether. Regulatory Random Daytime Sampling, for example, does not prescribe a fixed stagnation period because it is designed to represent water collected during ordinary consumer use rather than after a controlled period of non-use.
Having established how contact time governs dissolved lead release, the next variable becomes equally important. Even if two samples experience identical stagnation periods, they may still analyse different water. That depends upon how much water enters the bottle. The next section examines why sample volume determines which parts of the plumbing system are actually represented by the laboratory result.
Sample Volume: Which Water Went Into the Bottle?
If stagnation time determines how much lead may accumulate within standing water, sample volume determines which water is actually analysed. This distinction is one of the most important, and frequently overlooked, principles in lead sampling. Laboratories do not analyse “the water from the tap” in any general sense. They analyse only the water that entered the sample bottle. The volume collected therefore determines which hydraulic volumes within the plumbing system contribute to the analytical result.
Understanding sample volume is therefore not simply a question of how much water is required for laboratory analysis. It is a question of which part of the plumbing system is being represented by the sample.
A Tap Contains a Finite Volume of Water
Before a tap is opened, water occupies a series of connected hydraulic volumes extending from the outlet back towards the water main. These include the tap body, flexible connectors, isolation valves, internal distribution pipework, the private supply pipe and, where present, the communication pipe. Each section contains a finite volume of water.
The volume contained within any section of pipe is determined by a simple geometric relationship:
Volume = Cross-sectional area × Length
Consequently, the first water leaving a tap originates from the plumbing immediately adjacent to the outlet. As additional water is drawn, progressively more distant hydraulic volumes are displaced towards the tap. This principle is straightforward in theory but considerably more complex in practice. Domestic plumbing systems differ widely in their layout, pipe diameters, branch connections, dead legs, meters, valves and fittings. Water also mixes to varying degrees as it moves through the system. For these reasons, a given sample volume cannot be translated reliably into a fixed physical distance.
One litre of water does not universally represent one metre, five metres or ten metres of plumbing. The relationship depends entirely upon the geometry of the individual system. Sample volume should therefore be understood as defining how much of the hydraulic pathway contributes to the sample, rather than precisely where that water originated. Figure 3 illustrates the principle.
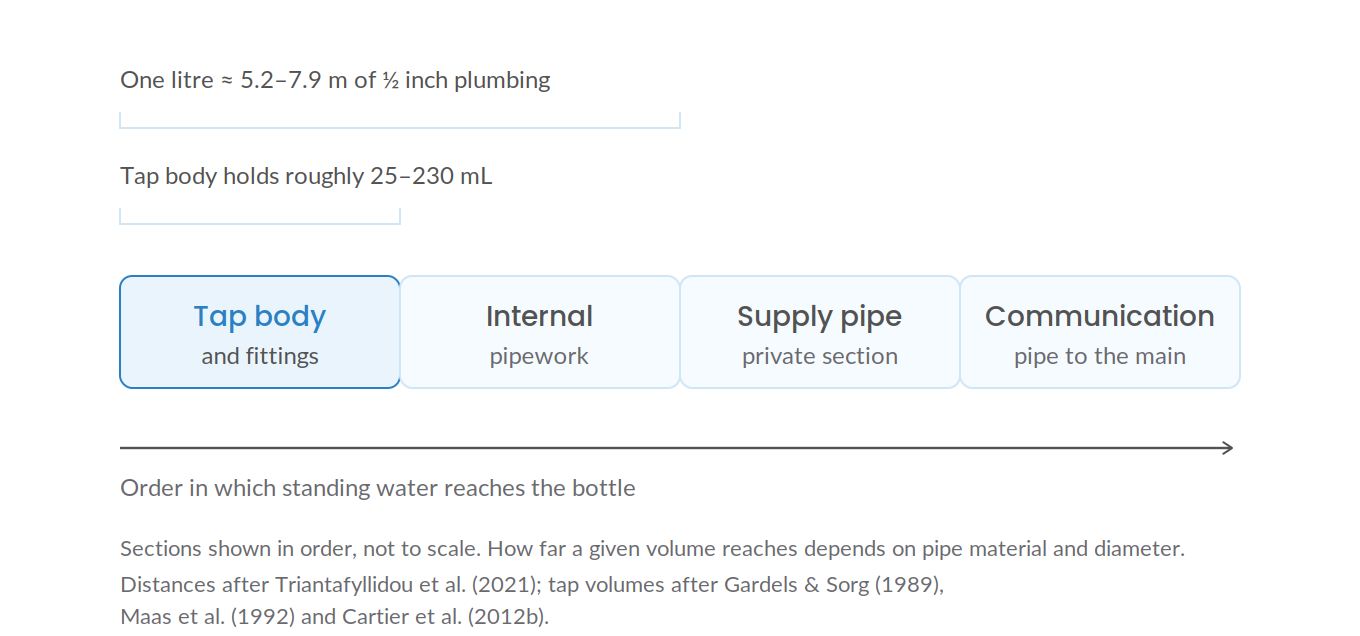
How sample volume determines which part of the route is captured. Sections are shown in order, not to scale.
Small Samples Can Isolate Near-Tap Sources
Because the first water leaving the outlet has occupied the plumbing closest to the tap, relatively small sample volumes may preferentially represent lead originating from nearby components.
This principle was demonstrated experimentally by Gardels and Sorg (1989)[5], who investigated lead leaching from domestic kitchen taps under controlled laboratory conditions. Twelve taps of differing design, material and manufacture were tested across detention times ranging from thirty minutes to thirty-four days, using both an aggressive distilled water and a non-aggressive treated supply. They reported that approximately 60–75% of the lead leached from a tap was contained within the first 125 mL of water collected following stagnation, and that after 200–250 mL had been discharged, 95% or more of the lead had normally been flushed from the tap.
The authors drew an explicit methodological conclusion from this. Determining the maximum lead concentration arising from a tap, they concluded, requires that both the cold and hot sides be sampled and that the samples be no larger than 100–125 mL. That is a recommendation about sample volume, published in 1989, arising directly from the hydraulic behaviour of the fitting.
Two qualifications should be attached. The experiments were conducted on North American kitchen faucets, whose internal waterway and brass body differ in configuration from many British taps; the hydraulic principle transfers directly, but the specific volumes should be read as indicative rather than as measurements of any particular fitting. The study also used laboratory test rigs rather than complete domestic plumbing systems.
The volume involved is small, and independently established. Three separate studies have measured the internal water volume of leaded kitchen taps and arrived at comparable figures: 56–135 mL [5], 65–150 mL [3] and 24–233 mL [2]. Across the three the range spans roughly 25 to 230 mL. A one-litre sample therefore dilutes whatever the tap body contributed into four to forty times its own volume, which is the arithmetic behind the recommendation above.
Nevertheless, the study established an important hydraulic principle. Small sample volumes can preferentially capture lead released from components immediately adjacent to the outlet. Increasing the sample volume progressively incorporates water originating further upstream, reducing the relative contribution of these localised sources. The implication is significant. Where the objective is to investigate lead release from the tap itself or nearby fittings, a relatively small sample volume may provide greater sensitivity than a larger integrated sample.
A One-Litre Sample Integrates More Plumbing
Larger sample volumes answer a different question. A one-litre sample does not simply contain more water. It contains water drawn from a larger portion of the plumbing system. Triantafyllidou et al. (2021)[11] put a figure on it: at a typical half-inch internal diameter, one litre drawn after stagnation corresponds to roughly 5.2 to 7.9 metres of plumbing, the range reflecting differences in pipe material. As progressively greater volumes are collected, the sample becomes an integration of multiple hydraulic regions rather than a representation of the plumbing nearest the outlet.
This distinction is sometimes described as dilution, but that term can be misleading. Nothing is added to the sample. Instead, the bottle progressively fills with water that occupied different locations within the plumbing system immediately before sampling began.
Triantafyllidou and colleagues describe this process in hydraulic terms, noting that under typical domestic conditions a one-litre sample may incorporate water originating from approximately five to eight metres of premise plumbing. The same review cites reported tap and fitting volumes in the range of approximately 24 to 233 mL. The disparity is instructive: a component holding a fraction of a litre may be the dominant lead source, yet occupy only a small proportion of a one-litre bottle. Consequently, a relatively small volume of water containing an elevated lead concentration may become averaged with larger volumes containing substantially lower concentrations.
The laboratory therefore reports the concentration present within the combined sample, not the maximum concentration that may have existed within one particular section of the plumbing system before sampling. Neither a small-volume sample nor a one-litre sample is inherently superior. Each represents a different portion of the plumbing system and therefore answers a different spatial question.
Dilution Within the Bottle
The effect of sample volume is perhaps most easily understood by considering what happens when water from different hydraulic regions enters the same bottle. Suppose the first portion of water leaving a tap contains an elevated concentration because it has remained within a lead-containing fitting, while water arriving later originates from pipework contributing relatively little lead. Collecting only the initial volume may produce a relatively high analytical result. Continuing to collect water progressively incorporates lower-lead water into the same bottle, reducing the average concentration reported by the laboratory.
The analytical result remains entirely correct.
What has changed is the composition of the sample. The laboratory measures the average concentration within the collected volume, not the highest concentration that existed anywhere within the plumbing system immediately before sampling. This distinction explains why increasing the sample volume may reduce the reported concentration even though no lead has been removed from the plumbing itself. The additional water simply changes the hydraulic mixture contained within the bottle.
What the Evidence Does—and Does Not—Show
The available evidence provides strong support for the conclusion that sample volume materially influences measured lead concentrations and their interpretation. Controlled laboratory experiments, sequential sampling studies and hydraulic analyses all demonstrate that different sample volumes represent different portions of the plumbing system. At the same time, an important limitation should be recognised.
Despite extensive research, no published study has been identified that systematically compares lead concentrations collected under otherwise identical field conditions using a comprehensive series of fixed sample volumes—for example, 125 mL, 250 mL, 500 mL and one litre—from the same domestic plumbing system. Our understanding therefore comes from several complementary lines of evidence rather than from one definitive bottle-volume experiment.
This is not a weakness in the evidence but a reflection of the complexity of real plumbing systems. Controlled tap experiments, sequential sampling investigations and hydraulic reasoning all point in the same direction: sample volume changes which water enters the bottle, and changing the water changes the meaning of the result.
Recognising this principle leads directly to one of the most widely misunderstood assumptions in lead sampling—that the first water leaving the tap necessarily contains the highest lead concentration. The experimental evidence demonstrates that this is not always the case. The next section examines why.
First Draw Does Not Necessarily Mean Highest Lead
One of the most intuitive assumptions in lead sampling is that the first water leaving a tap after a period of stagnation must also contain the highest lead concentration. At first sight, this appears entirely logical. Water nearest the outlet has remained stationary for the duration of the stagnation period and has therefore had the longest opportunity to accumulate dissolved lead.
The scientific evidence shows that this assumption is not universally correct. Where the principal source of lead lies immediately adjacent to the outlet, the first water may indeed contain the highest concentration. However, where the dominant source is located further upstream—within internal plumbing, a private supply pipe or a lead communication pipe—the highest lead concentration may not reach the outlet until substantially larger volumes of water have already been discharged.
The distinction is fundamental because it separates two concepts that are often treated as though they were synonymous:
First draw describes where the sampled water was located within the plumbing system.
Highest lead concentration describes which hydraulic volume contained the greatest lead contribution. These are not necessarily the same thing.
What First-Draw Sampling Actually Captures
The first water emerging from a tap represents the hydraulic volume immediately adjacent to the outlet at the moment the tap is opened. Depending upon the plumbing configuration, this water may have occupied:
- the tap body;
- flexible tap connectors;
- short branch pipes;
- nearby internal distribution pipework; or
- a combination of these components.
It does not automatically represent every section of plumbing upstream. Nor does it necessarily contain water that has travelled through the entire lead-containing portion of the system immediately before reaching the outlet. Consequently, a first-draw sample should be understood as representing the first hydraulic volume, not the entire plumbing system.
This distinction becomes increasingly important where lead sources are distributed unevenly throughout the system.
When the Lead Source Is Further Upstream
Many domestic plumbing systems contain several potential sources of lead. Some are located close to the tap, such as brass fittings, valves or older solder joints. Others may be situated much further upstream, including internal lead pipework, private lead supply pipes or lead communication pipes connecting the property to the water main.
Where the principal source lies close to the outlet, the first water reaching the sample bottle may indeed contain the highest lead concentration. Where the principal source lies further upstream, however, the water occupying that section of plumbing cannot reach the outlet until the hydraulic volumes located ahead of it have first been displaced.
In these circumstances, the first sample may contain relatively modest lead concentrations even though substantially higher concentrations remain elsewhere within the plumbing system. The timing of the concentration peak therefore depends not simply upon stagnation time but also upon the physical location of the lead source within the hydraulic pathway.
Evidence from the Flint Sequential Sampling Programme
Perhaps the clearest demonstration of this principle comes from the sequential sampling investigations undertaken in Flint, Michigan. Rather than collecting a single sample, Lytle and colleagues collected successive aliquots as progressively larger volumes of water were drawn from domestic taps. The resulting concentration profiles demonstrated that the highest lead concentration frequently occurred well after the initial sample had been collected.
At one property, the lead concentration reached approximately 149 µg/L at around 1.25 litres into the sequential draw rather than within the initial 125 mL sample. Other properties exhibited their highest concentrations at still greater cumulative sample volumes, indicating that the dominant lead contribution originated from plumbing located further upstream.
These field observations provide direct experimental evidence that the first water leaving the tap is not necessarily the water containing the greatest lead concentration. The location of the lead source determines where the concentration peak appears within the draw.
First Draw and Worst Case Are Not Synonyms
This distinction has important practical implications.
First-draw sampling is often described as representing a “worst-case” condition because it follows a period of stagnation. While this may be true where the principal lead source is located close to the outlet, it cannot be assumed universally. A first-draw sample may underestimate the maximum concentration present within the plumbing system if the dominant lead source lies further upstream.
Equally, a later sample collected during the same draw may exhibit substantially higher concentrations despite originating from water that has travelled further through the plumbing. The phrase “first draw” therefore describes the sampling protocol. It does not guarantee that the resulting concentration represents the highest lead concentration present within the system.
Why This Matters
Sampling protocols do not simply produce different numerical results. They collect different water.
A first-draw sample answers one question:
What is the lead concentration in the water occupying the plumbing immediately adjacent to the outlet when sampling begins?
It does not automatically answer another equally important question:
Where within the plumbing system is the greatest lead contribution located?
Answering that question requires more than a single bottle. It requires examining how lead concentration changes as progressively larger hydraulic volumes move through the system. That is the purpose of sequential sampling, the subject of the next section.
Sequential Sampling: Turning One Number Into a Profile
A conventional lead sample produces a single analytical result. Whether collected as a Random Daytime sample, a first-draw sample or a flushed sample, the laboratory ultimately reports one concentration for one bottle. While that result may answer a specific question, it reveals little about how lead concentration changes throughout the plumbing system.
Sequential sampling adopts a fundamentally different approach. Instead of collecting a single sample, successive aliquots are collected as water continues to flow from the same outlet. Each bottle represents water that occupied a different hydraulic position immediately before sampling began. Rather than producing one concentration, sequential sampling produces a concentration profile.
The objective is no longer simply to determine how much lead is present, but to understand how lead concentration changes as progressively larger hydraulic volumes move through the plumbing system. This distinction transforms the investigation from a single analytical measurement into a hydraulic interpretation of the system.
What Sequential Sampling Does
Sequential sampling involves collecting a series of individual samples from the same tap during one continuous draw. The volume of each aliquot is defined before sampling begins. Depending upon the investigation, these may be equal-volume bottles collected throughout the draw or a combination of smaller initial aliquots followed by larger samples. Each bottle is analysed separately.
The result is a sequence of lead concentrations plotted against cumulative volume drawn from the tap.
Instead of asking:
What was the lead concentration in this sample?
sequential sampling asks:
How does lead concentration change as progressively more of the plumbing system contributes to the sample?
That difference is profound.
A single sample provides one measurement.
A sequential series provides a pattern.
Lead Concentration as a Function of Cumulative Volume
Because each successive bottle represents water originating from progressively further upstream, the concentration profile reflects the hydraulic structure of the plumbing system rather than simply its average lead concentration. Where lead sources are distributed unevenly, concentrations may:
- remain consistently low throughout the draw;
- decline steadily after an initial peak;
- rise progressively before falling again;
- exhibit multiple peaks; or
- fluctuate as different hydraulic volumes reach the outlet.
The profile therefore contains information that cannot be obtained from any individual bottle in isolation. It provides evidence not only of how much lead is present, but also when particular lead contributions reach the sampling point.
What a Concentration Peak Can Tell Us
When interpreted alongside knowledge of the plumbing system, concentration peaks may help identify the most likely location of important lead sources. For example, a peak occurring immediately after sampling begins may be consistent with lead originating close to the outlet, such as within the tap body, nearby fittings or short sections of internal pipework.
A peak occurring only after substantially larger volumes have been discharged suggests that the principal lead contribution originates further upstream, perhaps within internal distribution pipework, a private supply pipe or a communication pipe. This approach formed the basis of the sequential investigations undertaken during the Flint water crisis.
Lytle and colleagues collected two initial 125 mL aliquots followed by successive one-litre samples. Rather than observing a simple decline in concentration after the first draw, many properties exhibited pronounced concentration peaks later in the sampling sequence. At one property, a concentration of approximately 149 µg/L occurred at around 1.25 litres into the draw, while other properties exhibited maximum concentrations at still greater cumulative volumes.
These observations demonstrated that the first water leaving the tap did not necessarily contain the greatest lead concentration. In those properties, the dominant lead contribution originated from hydraulic volumes located further upstream. Sequential sampling therefore provided evidence that would have been entirely missed by a single first-draw sample.
What a Concentration Peak Cannot Tell Us Automatically
Despite its diagnostic value, sequential sampling has important limitations. Perhaps the most common misconception is that a particular sample volume can be translated directly into a particular section of pipework—for example:
- the first litre represents internal plumbing;
- the third litre represents the supply pipe;
- the fifth litre represents the communication pipe.
The evidence does not support such universal interpretation. The relationship between cumulative sample volume and physical location depends upon numerous factors, including:
- pipe diameter;
- pipe length;
- plumbing layout;
- branch connections;
- dead legs;
- valves and water meters;
- hydraulic dispersion;
- flow rate; and
- previous water use.
Identical cumulative sample volumes may therefore represent very different physical locations in different properties. A concentration peak cannot, by itself, identify a particular plumbing component. It generates a hypothesis that must be interpreted alongside knowledge of the hydraulic system.
Source Attribution Tested by Removal
The strongest evidence arises when sequential sampling is combined with intervention. In Flint, properties identified as having lead service line contributions were subsequently reassessed following replacement of the lead service line. Whole-house sequential sampling demonstrated an average reduction in lead mass of approximately 86%, with reported reductions ranging from 80% to 94% across the evaluated properties.
The individual case is as instructive as the average. At the property whose profile peaked at approximately 149 µg/L, the concentration following replacement of the lead service line fell below 8 µg/L. The same tap, sampled using the same protocol, produced results differing by more than an order of magnitude—because one component of the plumbing system had been removed between the two investigations.
This sequence of evidence is particularly powerful. First, sequential sampling identified the hydraulic position of the dominant lead contribution.
Secondly, the suspected source was removed.
Finally, the concentration profile changed in the expected direction. The interpretation was therefore tested against the physical alteration of the plumbing system rather than relying solely upon inference. This illustrates one of the principal strengths of sequential sampling. It is not simply a method of measuring lead concentration. It is a method of developing and testing hypotheses about the location of lead sources within a plumbing system.
That strength should not be overstated. Sequential sampling is a powerful hypothesis-generating tool, but its interpretation remains probabilistic rather than deterministic. Different plumbing configurations may generate similar concentration profiles, hydraulic mixing blurs the boundaries between successive volumes, and the same profile may be consistent with more than one arrangement of lead-containing components. Source attribution should therefore be corroborated using independent evidence — inspection of the pipework, records of plumbing materials, or the change in concentration following removal of a suspected component — wherever it is practicable to do so.
The same logic has been applied at programme scale. Following the identification of lead in drinking water in Hong Kong in 2015, the authorities built a tiered sampling strategy in which each tier answered a different question [24]. The first tier was a single one-litre random daytime sample, used purely as a screen. Where that sample exceeded the standard, a second-tier sample was analysed to verify exposure: the tap was flushed for five minutes, left to stagnate for thirty, and a one-litre sample then taken. Alongside these, auxiliary samples were collected at the same visit but analysed only if an exceedance was found — a short run of sequential one-litre samples to establish whether the problem was confined to the premises, and a two-minute flushed sample taken specifically to confirm whether the flushing advice being given to consumers actually worked. The whole set could be collected from one apartment on a single occasion by trained samplers.
The design is instructive. Each protocol was matched to a question, the questions were arranged in order, and the more expensive diagnostic work was triggered only by a result that warranted it. The investigation concluded that soldered joints in copper pipework, present in a limited number of buildings, were the dominant source of lead, with brass fixtures and fittings identified as a secondary one [24] — a finding reached through sequential sampling rather than inferred from any single concentration.
From One Number to a Diagnostic Tool
Sequential sampling demonstrates more clearly than any other method that a lead result is evidence derived from a particular sampling strategy rather than a bare measurement. A single bottle answers one question; a sequential profile answers another. Where the objective is regulatory compliance or routine monitoring, a single sample may be entirely appropriate. Where it is to locate a lead source within the plumbing, no individual sample can supply what a profile does.
The next variable influencing that evidence is not where the water came from, but how it was collected. Flow rate can alter the hydraulic behaviour of the system and, under some conditions, the physical composition of the sample itself. That is the subject of the next section.
Flow Rate: When Opening the Tap Changes the Sample
The previous sections have shown that stagnation time determines how long water has remained in contact with plumbing materials, while sample volume determines which hydraulic volumes contribute to the bottle. A third variable is often given far less attention but can be equally important:
How quickly was the water drawn?
At first sight, flow rate might appear to be little more than a procedural detail. Whether a bottle is filled slowly or quickly, the same water would seem to pass through the tap. Experimental evidence demonstrates that this assumption is not always correct. Changing the flow rate can alter the physical behaviour of the plumbing system and, under some conditions, materially change the composition of the sample itself.
The reason lies in an important distinction between dissolved lead and particulate lead.
Dissolution and Particle Mobilisation Are Different Processes
Lead enters drinking water by two fundamentally different mechanisms. Dissolved lead accumulates while water remains in contact with lead-containing materials. It is controlled primarily by corrosion chemistry, contact time and water quality. Increasing the flow rate during sampling does not alter the amount of dissolved lead that has already entered solution during stagnation.
Particulate lead behaves differently.
Rather than entering solution gradually, particulate lead consists of microscopic fragments of corrosion products or lead-containing deposits that become detached from plumbing surfaces and are carried within the flowing water. The mobilisation of these particles is influenced not only by water chemistry but also by hydraulic forces acting upon the plumbing system during sampling.
Consequently, changing the flow rate may have relatively little effect on dissolved lead while having a much greater effect on the mobilisation of particulate lead. This distinction explains why flow rate is not simply an operational detail but a sampling variable capable of influencing the analytical result.
Evidence from the Doré Flow Experiment
The importance of flow rate is illustrated clearly by the experimental work of Doré and colleagues. Using harvested lead service lines under controlled laboratory conditions, the researchers compared a full lead service line against two partial replacement configurations — copper upstream of lead, and lead upstream of copper — while varying water chemistry and sampling flow rate. Increasing the sampling flow rate from 5 L/min to 15 L/min produced an approximately 78-fold increase in particulate lead release in the lead-upstream-of-copper configuration.
The result is striking, but it requires careful interpretation. The study does not demonstrate that tripling the flow rate universally increases lead concentrations by seventy-eight times. The effect was observed in that configuration alone; it did not occur in the full lead service line, nor in the configuration with copper upstream of lead. The magnitude of the response therefore depended on the arrangement of dissimilar metals within the pipework rather than on flow rate as such.
What the experiment does demonstrate convincingly is that flow rate can materially influence the particulate fraction of a lead sample. The analytical result therefore depends not only upon how long the water remained stagnant and how much water was collected, but also upon the hydraulic conditions under which the sample was drawn.
The authors drew an explicit methodological conclusion from their findings. Their results, they wrote, support the definition of sampling protocols targeted for the detection of lead and copper sources, and the proscription of flushing prior to sampling. Protocol should follow purpose; and where the purpose is detection, flushing beforehand defeats it.
Why Flow Rate Matters
The practical implications extend beyond the laboratory. Imagine two investigators sampling the same tap after an identical period of stagnation. One opens the tap gently and allows the bottle to fill slowly. The other opens the tap fully, producing a much higher flow rate. If particulate lead is present within unstable corrosion deposits, the two investigators may collect water with materially different particulate content despite following what appears to be the same sampling protocol.
Both laboratory analyses may be entirely correct. The difference lies not in the analytical method but in the hydraulic conditions created during sampling. Flow rate therefore becomes another variable defining the evidence contained within the sample bottle.
Flow Rate and Sampling Objectives
The significance of flow rate depends upon the purpose of the investigation. Where the objective is routine regulatory compliance, a protocol may seek to minimise unnecessary variability by specifying how samples are collected. Where the objective is to investigate particulate mobilisation, the flow rate may itself become an experimental variable.
Why Flow Rate Belongs on the Sampling Record
Given its potential influence, flow rate should not be regarded as an incidental detail omitted from the sampling record. Where practicable, investigators should record whether the sample was collected:
- at a gentle flow;
- at a normal consumer flow;
- at a fully opened tap; or
- under another defined hydraulic condition.
Although many routine sampling programmes do not quantify flow precisely, documenting how the sample was collected assists subsequent interpretation and improves the reproducibility of repeat investigations. Like stagnation time and sample volume, flow rate forms part of the evidence.
A Variable That Changes the Sample
Flow rate completes the three principal variables. Stagnation time governs the opportunity for dissolved lead release; sample volume governs which hydraulic volumes contribute to the bottle; flow rate governs the conditions under which that water reaches the outlet, and may mobilise particulate material along the way.
That last point leads to the next distinction. Lead measured in a laboratory report is often discussed as though it were a single substance behaving in a single way. In reality the measured concentration may comprise two forms of contamination that arise through different mechanisms and respond differently to sampling conditions.
Dissolved Lead and Particulate Lead Are Not the Same Measurement Problem
Throughout this article, the term lead concentration has been used as though it describes a single measurable quantity. Analytically, that is true. A laboratory reports the concentration of lead present within the submitted sample. Scientifically, however, that concentration may comprise two fundamentally different forms of contamination: dissolved lead and particulate lead.
Although both contribute to the reported result, they originate through different mechanisms, respond differently to changes in sampling conditions and often answer different investigative questions. Failing to distinguish between them can lead to significant errors of interpretation. Figure 4 sets out the differences.
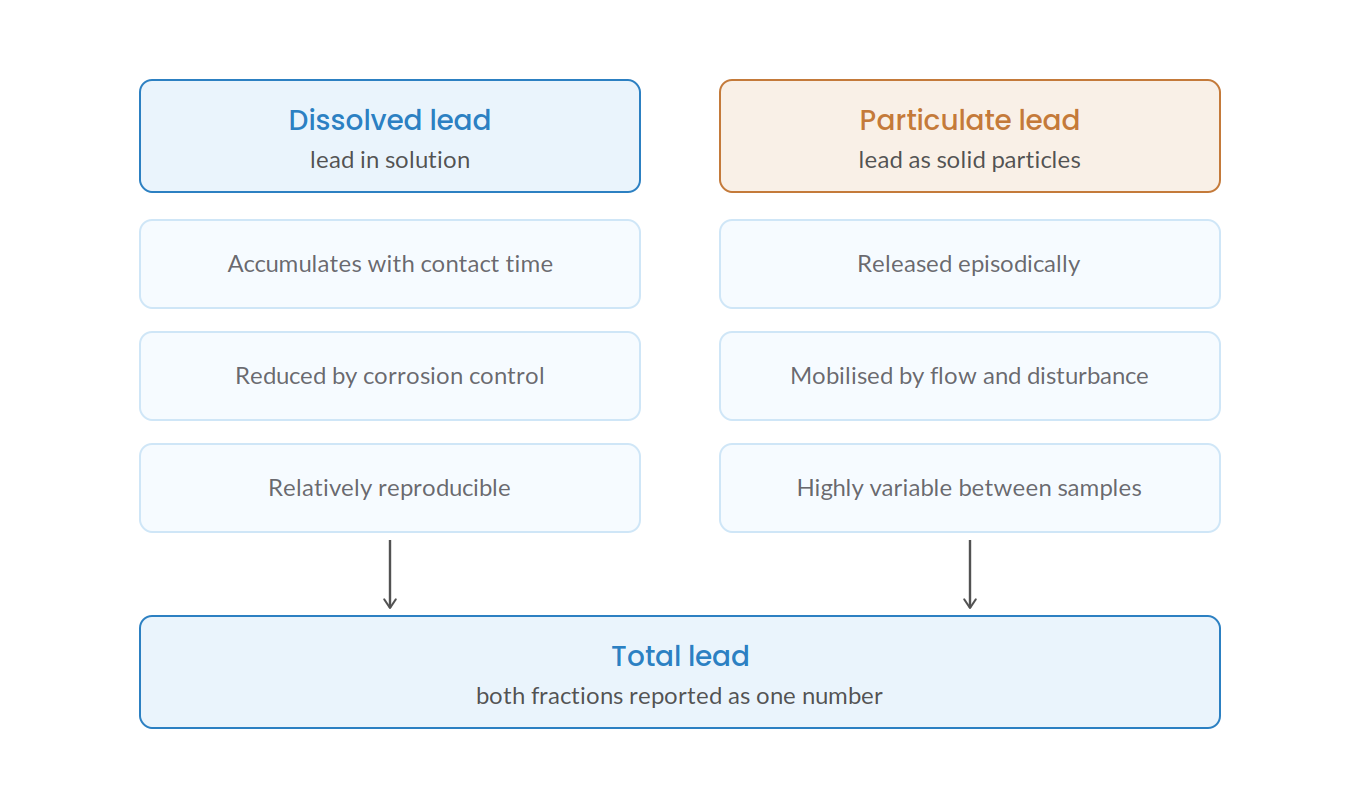
Dissolved and particulate lead compared. The two fractions arise by different mechanisms and respond differently to sampling conditions, yet a total lead result reports them as a single number.
Dissolved Lead
Dissolved lead consists of lead ions that have entered solution through chemical interaction between water and lead-containing materials. This is principally a corrosion process. As water remains in contact with lead pipework, lead-containing solder, brass fittings or other plumbing materials, small quantities of lead dissolve into the water. The amount released depends upon factors including contact time, water chemistry, temperature, corrosion-control treatment and the condition of the pipe surface.
Because dissolved lead accumulates gradually, it is strongly influenced by stagnation. Under otherwise similar conditions, longer contact times generally result in higher dissolved lead concentrations until equilibrium is approached. This behaviour explains why protocols specifying controlled stagnation periods have become central to many experimental investigations of lead release. The objective is to control one of the principal variables governing dissolved lead accumulation.
In general, dissolved lead changes relatively predictably because it is governed primarily by chemical processes.
Particulate Lead
Particulate lead behaves differently.
Rather than existing as dissolved ions, particulate lead consists of microscopic particles suspended within the water. These particles may originate from corrosion scales lining lead pipes, mineral deposits containing lead, fragments released during pipe disturbance or other particulate material detached from plumbing surfaces. Unlike dissolved lead, particulate lead is not produced simply by increasing contact time.
Its presence often depends upon physical disturbance. Changes in flow rate, pressure fluctuations, maintenance work, pipe vibration or the disruption of unstable corrosion deposits may all mobilise particles that subsequently become incorporated into the sampled water. Consequently, particulate lead is frequently more variable than dissolved lead. Two samples collected under apparently similar conditions may contain markedly different particulate contributions if one sampling event mobilises particles that remain attached during the other.
This variability is one reason why lead concentrations measured at the same tap may fluctuate even when the plumbing system itself has not changed.
This has direct consequences for sampling protocol. Research carried out for the Department of the Environment and published in 1986 concluded that the simple use of fixed time of stagnation samples is inadequate to assess exposure to galvanically corroded lead, and that identification surveys will generally miss situations where high lead concentrations are caused by galvanic corrosion [14]. Where lead is joined to dissimilar metals such as copper or brass, the resulting release is substantially particulate, episodic, and poorly captured by protocols designed around dissolved lead accumulation. The circumstances under which this arises during internal pipework alterations and repairs are examined in detail in our companion article on galvanic corrosion.
Later experimental work quantified the same effect. Comparing service line configurations across a range of flow rates, Cartier and colleagues found that a partial replacement leaving lead downstream of copper produced no net reduction in cumulative lead release when set against a full lead pipe — 85 mg as against 83 mg — and that partially replaced configurations were considerably more likely to produce particulate lead spikes at higher flow rates, while releasing less at very low flow [1].
Why Particles Produce Concentration Spikes
One of the most striking features of particulate lead is its ability to produce short-duration concentration spikes. Where dissolved lead accumulates progressively through chemical equilibrium, particulate lead may increase abruptly when corrosion deposits are disturbed. A relatively small number of lead-bearing particles entering the sample bottle can substantially increase the measured total lead concentration.
This behaviour helps explain why some field investigations report isolated high analytical results that are difficult to reconcile with surrounding samples collected under otherwise similar conditions. Such results should not automatically be dismissed as analytical error. Nor should they automatically be interpreted as representing the long-term average condition of the plumbing system.
They may instead reflect a genuine particulate mobilisation event occurring at the moment the sample was collected. The distinction is important because the sampling protocol itself may influence the likelihood of such events. As discussed in the previous section, changes in flow rate can materially alter particulate mobilisation without necessarily affecting dissolved lead to the same extent.
Total Lead and Filtered Lead
The distinction between dissolved and particulate lead also extends to laboratory analysis. Some investigations analyse total lead, in which both dissolved and particulate fractions contribute to the reported concentration. Others analyse filtered samples, in which larger suspended particles are removed before analysis in order to estimate the dissolved fraction alone.
These approaches answer different questions.
Total lead reflects the lead present in the submitted water as collected by the investigator. Filtered lead provides information about the dissolved fraction after particulate material has been removed.
Neither analysis is inherently more correct.
Each measures a different characteristic of the sample. For this reason, the analytical preparation should be understood before comparing results from different investigations. A reported lead concentration cannot be interpreted fully without knowing whether it represents total lead, dissolved lead or another defined analytical fraction.
Two Forms of Lead, One Laboratory Result
To the laboratory, dissolved and particulate lead contribute to the same analytical result. To interpretation they represent different processes: corrosion chemistry acting over time, and the physical mobilisation of lead-containing material. Both may be present in the same sample, both may contribute to exposure, and each responds differently to stagnation, flow rate, hydraulic disturbance and sampling technique.
The protocols examined in the following sections do not simply collect different volumes of water; they control different variables. Nowhere is this clearer than in the regulatory method used in England and Wales, which is examined next.
Sources of Uncertainty: Why No Protocol Can Be Universal
Before turning to the protocols themselves, it is worth setting out plainly why none of them can produce a universal answer. The preceding sections have examined variables that the investigator controls: how long the water stands, how much is collected, how quickly it is drawn. Alongside these sits a second category of variables that the investigator does not control and frequently cannot measure. These are properties of the building and its supply, and they differ from one property to the next.
It is worth being explicit about the relative size of the two kinds of uncertainty involved. Laboratory analysis of lead is a mature and accredited procedure: inductively coupled plasma mass spectrometry reaches limits of quantification of 0.1 to 0.2 µg/L in a laboratory accredited to ISO 17025, and several other established methods reach 1 to 5 µg/L [24]. Sampling introduces variation of an altogether different order. Concentrations have been found to differ more than tenfold in random daytime samples taken from the same tap over an extended period, and lead distributes unevenly enough within water that duplicate or triplicate samples are recommended simply to quantify the spread [24]. The dominant source of uncertainty in a lead result is therefore not analytical chemistry. It is whether the sample represents what the investigator believes it represents.
Water chemistry. The pH, alkalinity, temperature, chloride-to-sulphate mass ratio and the presence or absence of orthophosphate dosing all influence how readily lead enters solution. Two identical lead pipes carrying different waters will not release lead at the same rate. Corrosion scale. The deposits lining an old pipe are the product of decades of interaction between that particular water and that particular metal. Their composition, thickness and stability govern both how much dissolved lead is released and how readily particulate material detaches. No two are alike, and their condition cannot be established from the outside.
Plumbing configuration. Pipe diameters, lengths, branch connections, dead legs, meters, valves, storage arrangements and the sequence in which dissimilar metals are joined all determine which water reaches the outlet, and when. As earlier sections have shown, the same cumulative sample volume may represent quite different physical locations in different properties.
Occupancy and use. How many people live in a building, when they draw water, whether the property stands empty for periods, and whether the supply is shared all determine the hydraulic history of the water in the pipes at the moment a sample is taken. Temperature. Both dissolved lead release and the behaviour of corrosion deposits vary with temperature, which varies seasonally and by location within a building.
These variables interact. A change in water chemistry alters the corrosion scale over time; a change in occupancy alters the effective stagnation period; a partial pipe replacement alters both the configuration and the galvanic conditions at once.
The consequence is not that sampling is unreliable. It is that experimental findings describe the systems in which they were obtained, and transfer to other systems as principles rather than as values. A stagnation curve measured on one service line indicates the shape of the relationship between contact time and concentration; it does not predict the concentration at a particular tap after a particular interval. A sample volume that isolates a near-tap source in one property may integrate several components in another.
This is why the protocols examined in the following sections are described by what they are designed to establish rather than by the results they can be expected to produce. It is also why the sampling record, discussed later in this article, matters as much as the analytical result: without knowing the conditions under which a sample was collected, there is no basis on which to judge what it represents.
Random Daytime Sampling: A Test Designed for Compliance
Having examined the principal variables that influence lead concentration—stagnation time, sample volume, flow rate, hydraulic position and particulate mobilisation—we can now consider one of the most widely used lead-sampling protocols in England and Wales: Random Daytime Sampling (RDT). RDT occupies a distinctive position within lead sampling because it was not developed primarily to identify lead sources within individual properties, estimate the long-term exposure of a particular household or verify the effectiveness of remedial work. It was developed to answer a different question:
Does the public water supply comply with the regulatory standard for lead?
Understanding this distinction is essential. Many criticisms of Random Daytime Sampling arise not because the protocol is scientifically flawed, but because it is expected to answer questions for which it was never designed.
What Is Random Daytime Sampling?
Random Daytime Sampling is the prescribed compliance sampling protocol used for lead monitoring under the regulatory framework in England and Wales.
The requirements are explicit, and identical across both regulatory regimes. Regulation 12(4) of the Private Water Supplies (England) Regulations 2016 provides that compliance samples for chemical parameters including copper, lead and nickel must take the form of a random daytime sample of one litre volume taken at a consumer’s tap without prior flushing. Regulation 9(5) of the Water Supply (Water Quality) Regulations 2016 applies the same wording to public supplies. The Drinking Water Inspectorate’s guidance explains that random daytime means a one-litre sample taken at any time in the day without first flushing the tap, and that samples for these parameters are taken first in the order of sampling where several parameters are required.
The defining characteristics of Random Daytime Sampling are therefore:
- one-litre sample volume;
- collection during normal daytime use;
- no prescribed stagnation period;
- no prior flushing; and
- collection from the consumer’s tap.
Unlike first-draw sampling, RDT deliberately avoids imposing an artificial period of stagnation before sampling. Instead, it seeks to represent water under ordinary patterns of consumer use. The Inspectorate’s own explanation of the rationale is that a sample taken this way is representative of water that has been standing in contact with the internal domestic pipework.
A further feature concerns the selection of properties. Sampling locations are chosen at random, without regard to whether a property is known to contain lead pipework. Cardew (2009)[13] shows that lead concentrations measured at customer properties under this approach are erratic, and that much of the variation in lead performance between supply zones is accounted for by differences in the proportion of properties served by lead pipes. Because the resulting distributions are strongly skewed, they are analysed using non-parametric methods [12] and summarised using percentiles rather than means [13].
This is not to say that random daytime sampling has no diagnostic application at all. Hayes (2009)[6] developed a random daytime protocol incorporating a threshold concentration of 2.5 µg/L for identifying the likely presence of a lead service line. The distinction is one of purpose rather than of method: the same bottle, collected in the same way, becomes a screening instrument once it is interpreted against a threshold established for that question.
Why Does Random Daytime Sampling Exist?
The purpose of Random Daytime Sampling is often misunderstood. Its objective is not to identify the highest lead concentration that could occur within an individual property. Nor is it intended to locate the source of lead within a plumbing system. Its purpose is to provide a practical and statistically consistent method for assessing compliance with the regulatory lead standard across a public water supply or private water supply subject to regulatory monitoring.
Compliance monitoring inevitably requires a protocol that can be applied consistently across thousands of properties with widely differing plumbing configurations and patterns of water use. Random Daytime Sampling provides such a framework. It is therefore a population-level compliance tool, not an individual diagnostic investigation.
What Hayes Actually Demonstrated
The work of Hayes and later Hayes and Croft[7] is frequently cited in discussions of Random Daytime Sampling, but it is also frequently misunderstood. Their computational modelling investigated the representativeness and reproducibility of Random Daytime Sampling as a regulatory compliance method. The objective was to evaluate how well RDT performed when assessing compliance across supply zones containing many properties with differing plumbing characteristics and water-use patterns.
The research was not intended to establish that a single RDT sample could diagnose the source of lead within an individual property or define that property’s long-term exposure. Those are different scientific questions requiring different forms of evidence. Understanding the purpose of Hayes’ work is important because it reinforces the distinction between compliance monitoring and diagnostic investigation that runs throughout this article.
The “100 Samples” Misunderstanding
A further misunderstanding concerns the often-quoted figure of 100 samples. This has sometimes been interpreted as implying that approximately one hundred samples should be collected from an individual property before reliable conclusions can be drawn. That is not what the research demonstrated. The modelling considered the reproducibility of compliance monitoring at the zone or population level, where approximately one hundred annual Random Daytime Samples aggregated over successive years provided stable estimates of compliance performance.
The figure relates to statistical confidence within a monitored population. It does not imply that one hundred samples should be collected from a single household in order to establish its lead status. Confusing these two contexts risks applying population-level statistical reasoning to individual diagnostic investigations, for which it was never intended.
What One Random Daytime Sample Cannot Do
Because Random Daytime Sampling is prescribed for regulatory compliance, there are important questions that a single RDT result cannot answer on its own. An individual Random Daytime Sample cannot automatically determine:
- whether a property contains lead pipework;
- where lead is entering the plumbing system;
- the highest lead concentration present elsewhere within the system;
- the long-term exposure of the occupants; or
- whether replacing one particular component will resolve the problem.
These limitations should not be interpreted as weaknesses of the protocol.
They simply reflect the fact that the protocol was designed to answer a different question. WHO reaches the same conclusion. Its technical brief notes that random daytime results can mislead at household level because stagnation time is left to chance, and cites work finding more than tenfold variation in results taken from a single tap over an extended period [24]. Public Health Scotland states the same limitation in its own guidance, describing random daytime sampling as capturing variable stagnation times where there is no prior flushing, and therefore giving variable levels, with numerous samples required to estimate mean exposure [28].
Indeed, the regulatory framework itself recognises this distinction. Where a Random Daytime Sample exceeds the prescribed lead standard, the analytical result does not conclude the investigation. It initiates one. The Drinking Water Inspectorate makes clear that an exceedance requires investigation to establish the cause and determine appropriate remedial action. Simply repeating the sample and obtaining a lower result does not constitute an investigation.
A published DWI case study illustrates this process. A Random Daytime Sample returned a lead concentration of 55.8 µg/L[23], exceeding the regulatory standard. Subsequent investigation used additional sampling and flushing to identify the service pipe as the principal source of lead. Following a ten-minute flush, the lead concentration fell below 10 µg/L. The original Random Daytime Sample therefore answered the compliance question; the subsequent investigation answered the diagnostic question.
This distinction is central to understanding the role of Random Daytime Sampling within the wider regulatory framework. It is not a defective diagnostic test. It was never designed to be one. Recognising that principle leads directly to the broader conclusion emerging throughout this review. Lead sampling is undertaken for several fundamentally different purposes, each requiring different evidence and often different sampling strategies.
The next section examines these purposes directly and argues that much of the apparent disagreement surrounding lead sampling disappears once the underlying question is clearly defined.
Compliance, Exposure and Diagnosis Are Different Questions
The evidence reviewed so far points towards a single conclusion:
Different sampling protocols have been developed because they are intended to answer different questions.
Many apparent disagreements within the lead-sampling literature disappear once the objective of the investigation is clearly defined. A protocol that is entirely appropriate for one purpose may be poorly suited to another, not because it is scientifically deficient, but because it was designed to answer a different question.
Broadly, lead sampling in drinking water serves four distinct purposes:
- regulatory compliance;
- household exposure assessment;
- source identification; and
- post-intervention verification.
Although each ultimately produces a laboratory measurement of lead concentration, the evidence required—and therefore the sampling protocol selected—differs according to the question being asked. Figure 5 shows what five of the principal protocols actually capture from the same draw, and how little they overlap.
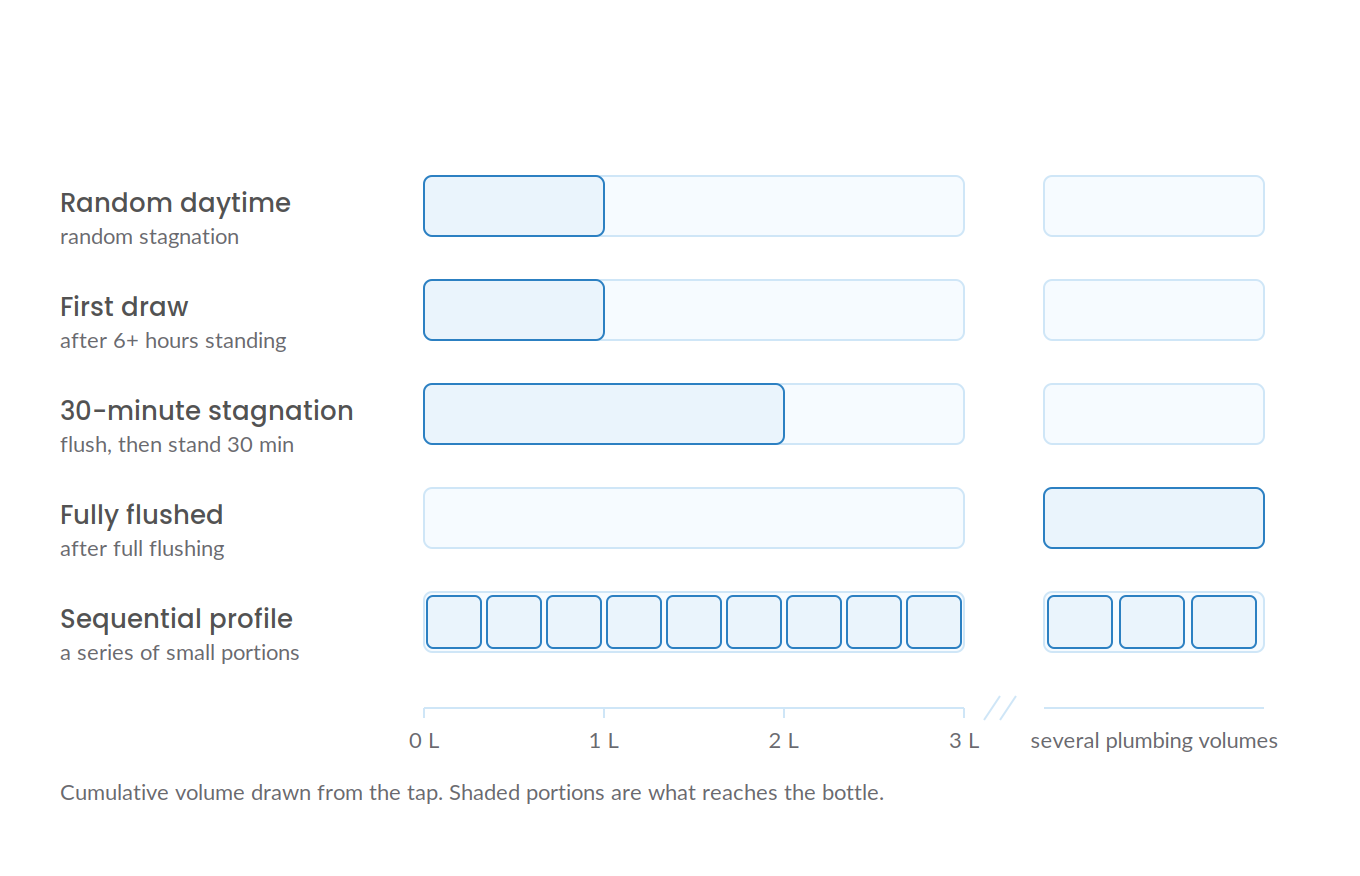
What five sampling protocols capture from the same draw. Random daytime and first draw take the same first litre, but after entirely different stagnation histories.
This is not a distinction peculiar to England and Wales. WHO tabulates sampling protocols under three headings — source investigation, exposure assessment and regulatory compliance — and assigns different methods to each [24]. Public Health Scotland has since adopted that structure in national guidance, tabulating seven sampling methods against what each is capable of establishing rather than prescribing a single procedure [28]. Section 18 examines that guidance and the position in England.
Regulatory Compliance
The objective of regulatory compliance sampling is straightforward:
Does the water supplied to consumers comply with the statutory lead standard?
This is fundamentally a regulatory question rather than an engineering or public-health investigation of an individual property. In England and Wales, this question is answered using nationally prescribed compliance monitoring arrangements. For public water supplies, monitoring is undertaken by water undertakers under the Drinking Water Inspectorate’s regulatory framework. For private water supplies, the regulations explicitly prescribe a one-litre Random Daytime Sample collected from the consumer’s tap without prior flushing.
The purpose is not to determine the highest lead concentration that could occur within the plumbing system or to identify the precise source of contamination. The purpose is to establish whether the regulatory standard has been exceeded. Where an exceedance is identified, the regulatory framework requires further investigation.
The compliance sample therefore provides the trigger for investigation rather than the investigation itself.
Household Exposure Assessment
Household exposure assessment asks a different question:
What concentrations of lead are occupants likely to ingest over time?
Unlike regulatory compliance, this question cannot usually be answered by reference to a single prescribed sampling protocol. People consume water under highly variable conditions. Some drink the first water drawn each morning. Others routinely flush the tap before filling a kettle. Water may be consumed after prolonged stagnation, after repeated household use or under numerous intermediate conditions.
Consequently, no single sampling protocol can be expected to represent every individual’s long-term exposure. The scientific literature reflects this complexity. Studies investigating household exposure have employed first-draw samples, Random Daytime Samples, repeated sampling, proportional sampling, composite sampling and other approaches, each selected according to the particular exposure question under investigation.
The objective is not regulatory compliance.
It is estimating what people are actually likely to drink.
One boundary should be drawn clearly at this point. The concentration of lead in water is one determinant of exposure, not the whole of it. Actual dose also depends upon how much water a person drinks, their age and physiology, and the proportion of their total lead exposure that is attributable to drinking water at all. This article is concerned with what a water sample can and cannot measure; the relationship between water lead concentrations and lead in the body is a separate question, addressed in our companion article on the epidemiological evidence.
Source Identification
Source identification asks a different question again:
Where is the lead entering the water?
Answering this question requires more than measuring lead concentration. It requires evidence capable of distinguishing between the potential sources within a plumbing system.
These may include:
- brass fittings;
- lead-containing solder;
- internal lead pipework;
- private supply pipes;
- communication pipes;
- or particulate material released from corrosion deposits.
Because these components occupy different hydraulic positions, source identification often relies upon comparative evidence rather than a single analytical result. Sequential sampling, controlled flushing, inspection of the plumbing system and knowledge of hydraulic layout may all contribute to the investigation. The laboratory concentration remains an essential part of the evidence, but it is interpreted alongside the physical characteristics of the plumbing system.
The objective is no longer simply to determine how much lead is present. It is to determine where that lead is coming from.
Post-Intervention Verification
The fourth objective is verification.
Once remedial work has been undertaken—whether replacing a lead service pipe, removing internal lead plumbing, replacing fittings or implementing another intervention—a further question arises:
Has the intervention materially reduced the lead contribution?
This is neither a compliance question nor a source-identification exercise. It is an evaluation of the effectiveness of the intervention itself.
Answering this question usually requires comparison.
The sampling protocol should be sufficiently consistent before and after the intervention to allow meaningful interpretation of any observed change. Differences in stagnation time, sample volume, flow conditions or sampling position may themselves alter the measured concentration and therefore complicate interpretation. Verification therefore depends not only upon laboratory analysis but also upon maintaining an appropriate and reproducible sampling methodology. WHO is specific on this point: verification sampling should repeat the protocol that produced the original result, and should continue until at least two monitoring events show the remedy has held [24].
One Measurement, Four Questions
These four objectives are closely related but not interchangeable. A protocol designed to establish compliance may not locate a lead source; one designed for source identification may not estimate long-term exposure; one designed for verification may be unsuitable for routine monitoring.
This explains why attempts to identify a single “best” lead-sampling method have proved unproductive. The question is not which protocol is best, but best for what purpose. An analytical concentration is not inherently a compliance result, an exposure estimate, a diagnostic finding or evidence of successful remediation; which of those it becomes depends on the question the protocol was built to answer.
The following sections examine the practical consequences, beginning with one of the most common misunderstandings in lead sampling: why a low result does not, by itself, prove that a property is free from lead pipework.
Why a Low Result Does Not Prove There Is No Lead Pipe
Perhaps the most common misunderstanding in lead sampling is the interpretation of a low analytical result. A laboratory report showing a lead concentration below the regulatory standard is often taken to mean that the property does not contain lead pipework or that lead is no longer present within the plumbing system. While this conclusion may ultimately prove to be correct, it does not follow from the analytical result alone.
A low lead concentration demonstrates only one fact:
The submitted sample contained a relatively low concentration of lead.
It does not establish why.
The distinction is important because several different plumbing systems, sampling conditions and hydraulic histories can produce the same analytical result. A concentration measured below the regulatory standard should therefore be interpreted cautiously. It provides evidence about the sampled water, not definitive evidence about the plumbing system as a whole.
The Sample May Not Have Included the Relevant Hydraulic Volume
As established at the outset, the laboratory measures only the water contained within the submitted bottle. If the hydraulic volume contributing the greatest lead concentration was not included within the sample, the laboratory cannot report it.
This may occur for several reasons.
The sample may have been collected before water from a lead supply pipe reached the outlet. It may have represented only water standing within plumbing immediately adjacent to the tap. Alternatively, the sampling protocol may have deliberately integrated water from several parts of the plumbing system, reducing the influence of a smaller high-lead volume.
In each case, the analytical result accurately describes the submitted sample while remaining silent about water that never entered the bottle.
Contact Time May Have Been Insufficient
Lead release is strongly influenced by stagnation. Water sampled shortly after previous use has had less opportunity to dissolve lead than water that has remained in contact with lead-containing materials for many hours. Consequently, two samples collected from the same tap on different occasions may legitimately produce different lead concentrations simply because the contact time differed.
A relatively low result may therefore reflect a relatively short period of stagnation rather than the absence of lead-containing plumbing.
The analytical chemistry remains correct.
The sampled water has changed.
Previous Water Use May Have Changed the Sample
The stated stagnation period at one outlet does not necessarily describe the hydraulic history of the entire plumbing system. Water use elsewhere within the property may have displaced some hydraulic volumes while leaving others undisturbed. Running another tap, flushing a toilet or operating household appliances can alter which water occupies different parts of the plumbing immediately before sampling.
Consequently, apparently similar sampling conditions may nevertheless produce different analytical results because different water ultimately reached the sample bottle. The result reflects the hydraulic history of the sampled water rather than a fixed property of the building.
Corrosion Control Can Reduce Dissolved Lead Without Removing Lead Pipework
A further consideration is corrosion control.
Water chemistry plays a major role in determining how much dissolved lead enters drinking water. Treatment processes designed to reduce plumbosolvency, including phosphate dosing where implemented, may substantially reduce dissolved lead concentrations even where lead pipes remain in service.
This is an important public-health success.
However, it also illustrates an important interpretative point. A low lead concentration does not necessarily demonstrate that lead-containing materials have been removed from the plumbing system. It may instead indicate that lead release has been reduced under the prevailing water chemistry. The distinction between the presence of lead and the release of lead should therefore be maintained.
The Principal Source May Lie Further Upstream
As discussed in earlier sections, lead sources located further upstream do not necessarily contribute to the first water collected at the tap. Sequential sampling studies have shown that concentration peaks may occur well after the initial sample, particularly where the dominant source lies within a lead supply pipe or communication pipe.
A single low result obtained from one sampling position therefore cannot exclude the possibility that higher concentrations exist elsewhere within the plumbing system. It simply indicates that those hydraulic volumes were not represented by the submitted sample.
Particulate Lead Is Inherently Variable
Particulate lead introduces a further source of uncertainty. Unlike dissolved lead, which generally changes gradually with contact time, particulate lead may occur intermittently as corrosion deposits become mobilised. A sample collected in the absence of particulate mobilisation may produce a relatively low concentration, while another sample collected under different hydraulic conditions may contain substantially more particulate lead.
Neither result is necessarily incorrect.
Each reflects the conditions present when that particular sample was collected. This variability reinforces the importance of interpreting individual analytical results within the context of the sampling protocol rather than treating them as permanent characteristics of the property.
Absence of Evidence Is Not Evidence of Absence
Taken together, these mechanisms demonstrate why a low analytical result cannot, by itself, prove that a property is free from lead pipework.
The result may reflect:
- the hydraulic volume that was sampled;
- the duration of stagnation;
- previous water use;
- the sample volume collected;
- the effectiveness of corrosion control;
- the location of the lead source within the plumbing system; or
- the absence of particulate mobilisation during sampling.
Each explanation is scientifically plausible.
Determining which applies requires additional evidence beyond the analytical concentration alone. This should not be interpreted as diminishing the value of a low lead result. On the contrary, a concentration below the regulatory standard is an important and reassuring finding within the context of the sampling protocol used. What it should not be interpreted as is definitive proof that lead-containing plumbing is absent or incapable of contributing lead under different sampling conditions.
The same principle applies in reverse.
Just as a low result does not prove the absence of lead pipework, a high result does not, by itself, identify where the lead came from. That distinction is the subject of the next section.
Why a High Result Does Not Identify the Source
If a low lead result should not automatically be interpreted as evidence that lead pipework is absent, the opposite is equally true. A high analytical result demonstrates that the submitted water sample contained an elevated concentration of lead. It does not establish where that lead entered the water.
This distinction is fundamental because lead can originate from several different components within a plumbing system, many of which may produce similar analytical results when viewed in isolation. The laboratory measures the concentration present within the submitted sample. It cannot determine which plumbing component contributed that lead. Figure 6 sets out where those components sit along the route.
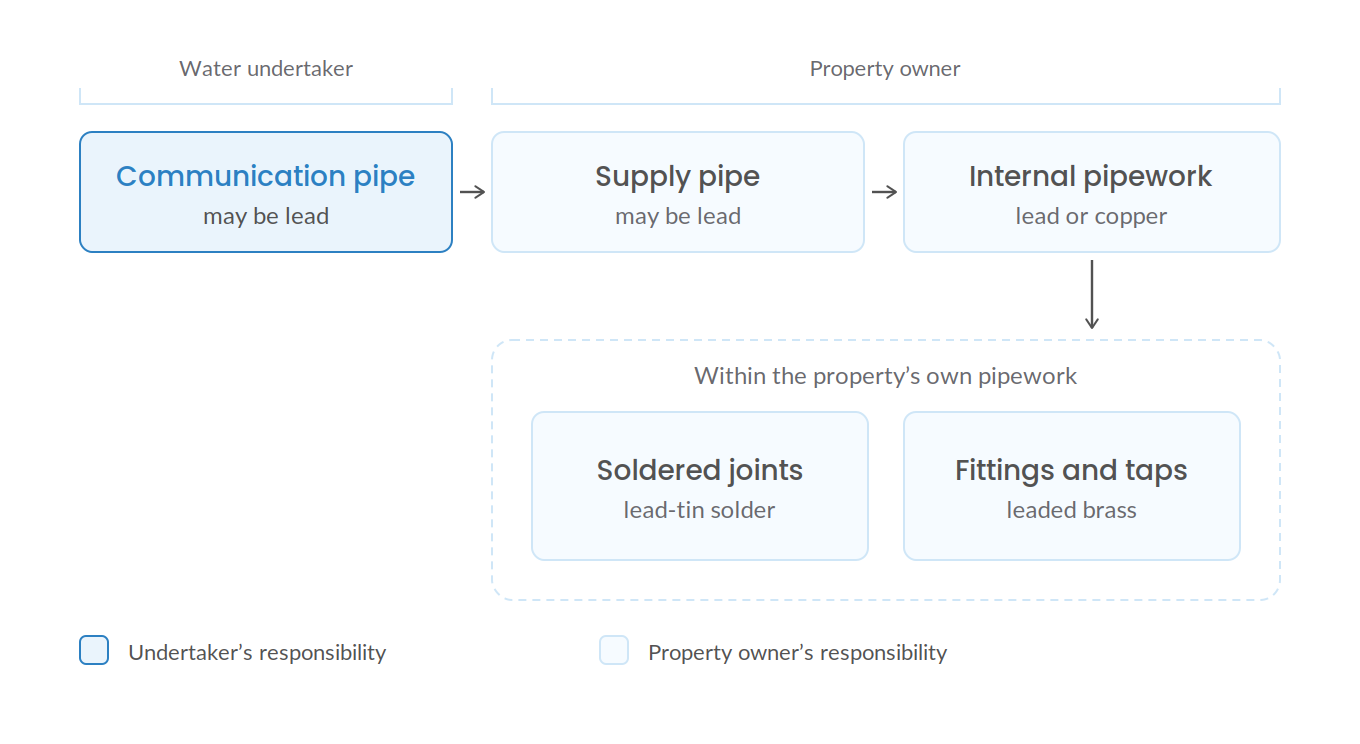
Where lead can enter between the main and the kitchen tap. Ownership changes at the boundary, but the water passes through every section regardless of who owns it.
Determining the source requires additional evidence.
Lead May Originate from Multiple Components
A domestic plumbing system may contain several potential sources of lead.
These include:
- lead communication pipes;
- private lead supply pipes;
- internal lead distribution pipework;
- lead-containing solder used in older plumbing;
- brass taps, valves and fittings;
- lead-containing corrosion deposits; and
- particulate material mobilised during sampling.
In some properties only one of these sources may be present.
In others, several may contribute simultaneously.
The analytical result alone cannot distinguish between these possibilities. Two properties may both produce a concentration of 20 µg/L, yet the underlying cause may be entirely different. In one property the principal contribution may originate from a lead communication pipe. In another it may arise from internal lead plumbing. In a third it may reflect the mobilisation of particulate material during sampling.
The numerical result is the same.
The plumbing problem is not.
Concentration Does Not Reveal Location
One of the most common misconceptions is that the magnitude of a lead result indicates where the source must be located. The evidence reviewed in this article does not support such an interpretation. A high concentration does not demonstrate that the lead source is:
- close to the tap;
- further upstream within the plumbing;
- within the private supply pipe; or
- within the communication pipe.
The concentration measures how much lead entered the sampled water. It does not identify where that transfer occurred. Location is a hydraulic question rather than an analytical one. Answering it requires information beyond the concentration itself.
Why Sequential Sampling Is Different
This is precisely why sequential sampling occupies a different role from routine compliance sampling.
A single bottle provides one concentration.
A sequential profile provides evidence of how concentration changes as progressively larger hydraulic volumes pass the sampling point. That pattern may indicate that the principal lead contribution is more likely to originate from one part of the plumbing system than another. For example, a concentration peak occurring immediately after the tap is opened may suggest that an important source lies close to the outlet.
Conversely, a peak occurring only after substantially larger volumes have been discharged suggests that the dominant contribution originates further upstream. Importantly, even sequential sampling does not identify the source automatically. It provides evidence that must be interpreted alongside knowledge of the plumbing layout, pipe diameters, branch connections, valves, meters and hydraulic behaviour.
The profile informs the investigation.
It does not replace it.
Corroborating the Interpretation
The strongest evidence for source identification arises when analytical results are combined with independent observations.
These may include:
- inspection of exposed pipework;
- records of plumbing materials;
- sequential sampling profiles;
- controlled flushing;
- comparison before and after replacement of suspected components; and
- knowledge of the building’s plumbing configuration.
The Flint investigations provide a good example of this approach. Sequential sampling suggested that the dominant lead contribution in many properties originated from the lead service line. That interpretation was subsequently tested by physically replacing the lead service line and repeating the sampling. The substantial reduction in lead concentrations following replacement provided independent evidence supporting the original interpretation.
The diagnosis therefore rested on multiple lines of evidence rather than on one analytical result alone.
Investigation Is Different from Measurement
This distinction is recognised within the regulatory framework itself. Where a Random Daytime Sample exceeds the prescribed lead standard, the Drinking Water Inspectorate does not regard the analytical result as identifying the cause of the exceedance.
Instead, it requires an investigation.
That investigation may involve additional sampling, flushing, inspection of plumbing materials, examination of treatment performance or other appropriate measures depending upon the circumstances. The analytical result identifies that a problem exists.
The investigation establishes why.
The regulatory process therefore mirrors the scientific principle developed throughout this article:
Measurement and diagnosis are not the same activity.
One Number Rarely Identifies One Cause
The temptation to identify a single cause from a single laboratory result is understandable. A concentration of 40 µg/L appears to invite a simple explanation. In practice, plumbing systems are rarely so straightforward.
Multiple lead-containing components may contribute simultaneously.
Corrosion chemistry may change over time.
Particulate mobilisation may introduce intermittent spikes.
Hydraulic conditions may alter which water reaches the outlet. The same analytical concentration may therefore arise through different combinations of physical and chemical processes. For this reason, a high lead result should be regarded as the beginning of an investigation rather than its conclusion. It demonstrates that lead entered the sampled water.
It does not, by itself, identify where that lead entered the system or which remedial action is required. Determining the source requires additional evidence, selected according to the question being asked. This principle leads naturally to another common misunderstanding. Consumers are often advised to flush a tap before using drinking water. While this may reduce lead concentration under many circumstances, a flushed sample should not automatically be interpreted as representing “mains water” or water unaffected by the plumbing system.
That distinction is the subject of the next section.
Why “Flushed” Does Not Automatically Mean “Mains Water”
Flushing a tap before collecting a water sample is one of the most common recommendations in public health advice relating to lead in drinking water. Public Health Scotland describes the purpose of a fully flushed sample as ensuring that mains water is being sampled, and notes that the time required to flush the system is influenced by the length of the supply pipes to the premises [28]. The reasoning is straightforward. Water that has remained stagnant within lead-containing plumbing generally contains higher concentrations of dissolved lead than water entering the building from the distribution network. Allowing the tap to run before use can therefore reduce short-term exposure under many circumstances.
This practical advice is both sensible and well established. However, an important distinction must be made between reducing exposure and interpreting a water sample. A flushed sample is often described informally as representing “fresh mains water.” Scientifically, that description is rarely precise. Flushing changes which hydraulic volumes contribute to the sample, but it does not automatically remove the influence of the plumbing system itself.
Flushing Is a Volume Problem, Not Merely a Time Problem
Consumers are commonly advised to run a tap for one, two or several minutes before collecting drinking water. While such advice is practical, time is only an indirect measure of what is actually happening within the plumbing system. What matters hydraulically is not how long the tap has been running, but how much water has passed through the system.
A kitchen tap delivering 15 litres per minute will discharge three times the volume of a tap flowing at 5 litres per minute over the same period. Two households each flushing for two minutes may therefore replace very different hydraulic volumes before collecting a sample. The relevant variable is not elapsed time.
It is the volume of water displaced.
Pipe Length and Diameter Matter
Even where identical volumes are discharged, different properties will not necessarily achieve the same hydraulic outcome. The volume required to replace stagnant water depends upon the internal geometry of the plumbing system, including:
- the length of the private supply pipe;
- pipe diameters;
- internal distribution pipework;
- branch connections;
- storage volumes; and
- the location of the sampling outlet.
A small flat with a short internal supply may require relatively little water before stagnant water has been displaced. A detached property with a long private supply pipe may require substantially more. Consequently, there is no universal flushing time that guarantees the sampled water represents the same hydraulic position in every building.
Mixing and Hydraulic Dispersion Matter
Real plumbing systems do not behave as perfectly efficient displacement pipes. As water moves through a plumbing system, mixing occurs between adjacent hydraulic volumes. Changes in pipe diameter, fittings, bends, valves, meters and branch connections all influence how water moves through the system. Some regions may be displaced rapidly, while others experience greater mixing or temporary retention.
For this reason, flushing does not produce a sharp boundary between “old water” and “new water.” Instead, there is a transition during which water originating from different parts of the plumbing system contributes to the sample in varying proportions. This is another reason why interpreting a flushed sample requires an understanding of the plumbing system rather than assuming that all stagnant water has been completely removed.
A Flushed Sample Still Reflects the Plumbing System
Perhaps the most important point is this:
Water entering the building must still travel through the building.
Even after prolonged flushing, water reaches the tap only after passing through the communication pipe, private supply pipe, internal plumbing and the outlet itself. If any of these components continue to contribute lead under flowing conditions, the flushed sample will continue to reflect those contributions. Conversely, if flushing successfully displaces stagnant water that had accumulated dissolved lead within a localised section of plumbing, the measured concentration may fall substantially.
Neither outcome is surprising.
They simply demonstrate that flushing changes which water enters the bottle. It does not remove the plumbing system from the sampling process.
What a Flushed Sample Can Tell Us
A flushed sample can provide valuable information when interpreted within the context of the investigation. Comparison between first-draw and flushed samples may indicate whether stagnant water contributed significantly to the measured lead concentration.
A substantial reduction following flushing may suggest that lead accumulated during stagnation played an important role. The magnitude of that reduction is itself informative, and depends upon the configuration of the pipework. In the harvested service line experiments discussed earlier, high-velocity flushing before a sixteen-hour stagnation reduced total lead release by a factor of twelve where copper lay upstream of lead, by a factor of two in a full lead service line, and by only 1.6 where lead lay upstream of copper [4].
Persistently elevated concentrations after extensive flushing may indicate that lead continues to enter the water under flowing conditions or that the principal source lies further upstream.
These observations can inform subsequent investigation.
They should not, however, be interpreted as definitive source identification.
Flushing changes the hydraulic conditions.
It does not identify the plumbing component responsible for the observed change.
What a Flushed Sample Cannot Tell Us
Equally important are the limitations.
A flushed sample cannot automatically demonstrate:
- that all lead-containing plumbing has been bypassed;
- that the sampled water represents untreated water from the distribution main;
- that the plumbing system is free from lead;
- or that prolonged exposure would necessarily produce the same result.
Like every other sampling protocol discussed in this review, flushing answers one particular question while remaining largely silent on others.
The analytical result remains entirely correct.
Its interpretation depends upon understanding what water entered the bottle.
Flushing Changes the Question
Flushing, like every other protocol examined here, deliberately alters the sampling conditions in order to obtain evidence relevant to a particular objective. It is not a cleaner version of any other method; it is a different question asked of the same plumbing. The remaining sections move beyond individual sampling methods to consider how this evidence fits within the regulatory framework of England and Wales, what information should accompany every laboratory result, and why the first question should never be “Can you test my water for lead?” but rather:
“What question do we want the sample to answer?”
The England and Wales Sampling Gap
The preceding sections have examined the scientific principles that govern lead sampling and the different questions that individual sampling protocols are designed to answer. A further question now arises:
How are these different sampling objectives reflected within the regulatory framework in England and Wales?
The answer is both revealing and central to the argument developed throughout this article. England and Wales has a clearly defined national framework for regulatory compliance monitoring. That framework specifies how compliance samples are to be collected, who is responsible for collecting them, the standard against which they are assessed and the regulatory response when that standard is exceeded.
For the other three objectives considered in this review—household exposure assessment, source identification and post-intervention verification—no equivalent nationally prescribed sampling protocols have been identified. This distinction does not imply that these investigations are not undertaken. On the contrary, they are routinely performed by water companies, local authorities, public-health specialists, consultants and researchers. The distinction is that they are undertaken using methods selected according to the circumstances of the investigation rather than under a single nationally prescribed sampling framework comparable to regulatory compliance monitoring.
Regulatory Compliance
Regulatory compliance monitoring occupies a unique position because its purpose is defined in legislation. Both regulatory regimes prescribe the method in the same terms. Water undertakers monitor public supplies in accordance with the Water Supply (Water Quality) Regulations under the oversight of the Drinking Water Inspectorate; local authorities monitor private supplies under the Private Water Supplies Regulations. In each case, compliance samples for lead, copper and nickel are prescribed as one-litre random daytime samples collected from the consumer’s tap without prior flushing.
The objective is equally clear.
The sample determines whether the statutory lead standard of 10 µg/L has been exceeded. The analytical result therefore answers a defined regulatory question using a nationally prescribed sampling methodology.
Compliance Is Not the Investigation
The regulatory framework also makes an important distinction that closely mirrors the scientific argument developed throughout this article. A compliance sample demonstrating an exceedance does not complete the investigation.
It begins it.
The Drinking Water Inspectorate makes clear that where a lead standard is exceeded, the cause must be investigated. Simply collecting another sample and obtaining a lower analytical result does not constitute an investigation. The published case studies illustrate this distinction clearly. In one investigation, a Random Daytime Sample produced a lead concentration of 55.8 µg/L, exceeding the regulatory standard. Subsequent investigation used additional sampling and controlled flushing to determine that the principal contribution originated from the service pipe. Following flushing, the measured concentration fell below the regulatory limit.
The sequence is instructive.
The original compliance sample answered one question:
Has the statutory standard been exceeded?
The subsequent investigation answered another:
Why has it been exceeded?
The compliance sample did not diagnose the source.
The investigation did.
The regulatory process itself therefore recognises that demonstrating a problem and identifying its cause are separate activities requiring different forms of evidence.
Household Exposure Assessment
The position is different when the objective is to estimate the lead concentrations that occupants are likely to ingest over time. No equivalent nationally prescribed England and Wales protocol has been identified specifying:
- the sampling procedure;
- stagnation period;
- sample volume;
- flow conditions;
- interpretation; or
- decision criteria
for assessing the chronic lead exposure of an individual household. Instead, the scientific literature contains a range of different methodologies selected according to the objectives of individual investigations. First-draw sampling, Random Daytime Sampling, repeated sampling, proportional sampling and composite sampling have all been employed to investigate different aspects of household exposure.
The absence of a single nationally prescribed protocol does not imply scientific uncertainty. It reflects the fact that household exposure is a fundamentally different question from regulatory compliance.
Source Identification
The same distinction applies to source identification. Where the objective is to determine where lead enters the plumbing system, no single nationally prescribed diagnostic sampling protocol equivalent to the compliance monitoring regime has been identified. The Drinking Water Inspectorate requires investigation following an exceedance, but it does not prescribe one universal diagnostic sequence applicable to every property.
Instead, investigators may use combinations of:
- sequential sampling;
- flushed sampling;
- inspection of plumbing materials;
- hydraulic interpretation;
- replacement of suspected components; and
- repeat sampling.
The investigative approach depends upon the characteristics of the individual plumbing system and the question being addressed. Diagnosis is therefore an engineering and scientific investigation rather than a nationally standardised sampling procedure.
Post-Intervention Verification
A similar position exists following remedial work. Where lead pipes have been replaced or other interventions undertaken, the obvious question becomes:
Has the intervention materially reduced the lead contribution?
Again, no equivalent nationally prescribed England and Wales protocol has been identified defining:
- when verification samples should be collected;
- the required stagnation period;
- sample volume;
- number of samples;
- acceptance criteria; or
- interpretation framework.
Verification sampling is routinely undertaken in practice, but the methodology is selected according to the circumstances of the investigation rather than through a nationally prescribed lead-verification protocol equivalent to compliance monitoring. The contrast with international guidance is worth noting. WHO sets out both a method and a stopping rule — repeat the protocol that found the lead, and continue until two monitoring events confirm the remedy has held [24]. No equivalent prescription exists in England and Wales.
A Comparison Within the United Kingdom
A further divergence has emerged since these regulations were made, and it concerns public health rather than compliance. In November 2025 Public Health Scotland published guidance setting out how drinking water should be sampled when elevated lead is investigated as a public health matter; no equivalent published guidance has been identified for England. That divergence is examined in Section 18. No assessment has been made here of the position in Northern Ireland or the Republic of Ireland in respect of public health sampling, and none should be inferred from the table above, which concerns compliance monitoring only.
One further observation is worth recording, because it demonstrates that the position in England and Wales reflects a choice rather than a technical inevitability. All four United Kingdom jurisdictions prescribe the same compliance method. In Northern Ireland, the Water Supply (Water Quality) Regulations (Northern Ireland) 2017 and the Private Water Supplies Regulations (Northern Ireland) 2017 both require that samples for copper, lead and nickel be taken at the consumer’s tap without prior flushing, as a random daytime sample of one litre volume — wording materially identical to that used in England and Wales.
| Jurisdiction | Prescribed compliance method | Alternative permitted | Instruments |
|---|---|---|---|
| England and Wales | One-litre random daytime sample at the consumer’s tap, without prior flushing | No | SI 2016/614 reg 9(5); SI 2016/618 reg 12(4); WSI 2018/647[16, 15, 17] |
| Northern Ireland | One-litre random daytime sample at the consumer’s tap, without prior flushing | No | SR 2017/212; SR 2017/211[20, 21] |
| Scotland | One-litre random daytime sample | Yes — a fixed stagnation time method, provided that at supply zone level it does not result in fewer cases of non-compliance | SSI 2014/364 Sch 3; SSI 2017/282 Sch 3 Pt D[18, 19] |
| Republic of Ireland | One-litre random daytime sample | Yes — a comparable provision applies | SI 464/2017[22] |
Scotland differs in one respect. The Public Water Supplies (Scotland) Regulations 2014 and the Water Intended for Human Consumption (Private Supplies) (Scotland) Regulations 2017 prescribe the same one-litre random daytime sample, but permit an alternative: a fixed stagnation time method, provided that at supply zone level it does not result in fewer cases of non-compliance than the random daytime method.
That proviso is the significant part. It does not abandon the compliance objective, nor does it treat the two protocols as interchangeable. It recognises that more than one method may serve the same regulatory purpose, and imposes a test to ensure that the alternative is not simply more permissive than the method it replaces. A comparable provision appears in the Republic of Ireland’s European Union (Drinking Water) Regulations 2017.
No equivalent provision appears in the regulations applying to England, Wales or Northern Ireland, where the random daytime sample is prescribed without alternative. The point is not that one arrangement is superior to the other. It is that the choice of protocol, even for a single defined purpose, is treated as a matter for regulatory judgement in some jurisdictions and as settled in others.
The Regulatory Framework Supports the Central Thesis
Taken together, these observations strengthen rather than weaken the central argument of this review. England and Wales possesses a well-defined regulatory framework for answering one question:
Does drinking water comply with the statutory lead standard?
The regulatory architecture itself demonstrates that this question is distinct from the subsequent investigation. Where an exceedance is identified, further work is required to establish its cause and determine the appropriate remedial response. The compliance sample is therefore not, by itself, a source-diagnostic protocol. Beyond compliance monitoring, no equivalent nationally prescribed sampling frameworks have been identified for three other important objectives:
| Sampling purpose | Nationally prescribed England and Wales method identified? | Typical owner | Principal question |
|---|---|---|---|
| Regulatory compliance | Yes | Water undertaker / regulator; local authority for private water supplies | Does the sample comply with the statutory 10 µg/L standard? |
| Household exposure assessment | No equivalent national protocol identified | Public health, researcher or investigator | What concentrations might occupants actually ingest over time? |
| Source identification | No single nationally prescribed method identified | Water company, investigator or competent specialist | Where is lead entering the water? |
| Post-intervention verification | No equivalent national lead-verification protocol identified | Water company, contractor or investigator | Has the intervention materially reduced the relevant lead source? |
This distinction should be interpreted carefully.
It does not suggest that these investigations are unsupported or that appropriate methods do not exist. Rather, it demonstrates that England and Wales has developed a nationally prescribed sampling framework for regulatory compliance, while the remaining objectives are addressed through investigative methodologies selected according to the circumstances of each case.
That conclusion is entirely consistent with the scientific evidence reviewed throughout this article. Sampling protocols are not interchangeable because they are designed to answer different questions. The regulatory framework itself reflects that principle.
Sampling in a Public Health Investigation
This section concerns investigations arising from elevated blood lead concentrations, including in children. It is published by London & Surrey Water Services Ltd, a contractor with a commercial interest in lead pipe replacement, and reports only what the cited public documents state. It is not clinical guidance; anyone concerned about a child’s lead exposure should seek medical advice.
The Trigger Is a Person, Not a Supply
Every sampling purpose considered so far begins with a water supply. Compliance monitoring begins with a supply zone. Exposure assessment begins with a property. Source identification begins with a plumbing system. Public health investigation begins with none of these. It begins with a blood test.
In England, health protection teams and local authority public health teams are notified when a child under 16 years of age is found to have a blood lead concentration at or above 0.24 µmol/L, equivalent to 5 µg/dL. For adults the notification concentration is 0.48 µmol/L, equivalent to 10 µg/dL, except for pregnant women, where the lower figure applies because of the risk to the unborn child. At the intervention concentration the exposure is treated as unlikely to be background, and as indicating a source or sources affecting that individual [25]. The threshold was halved on 5 July 2021, and the public health intervention concentration for children is now the same in England, Wales and Scotland.
The question being asked is therefore different in kind from any considered earlier in this review. It is not whether a supply meets a standard, nor what a population is exposed to on average. It is whether the drinking water at a particular address is contributing to the measured lead burden of a particular person. That is simultaneously an exposure question and a source question, asked about one household, under time pressure, with a child’s health as the reason for asking.
What England Publishes
The relevant English guidance sets out the notification concentrations, the roles of the agencies involved, and the routes by which a source may be investigated. On drinking water it states that where the source is potentially drinking water, the local water company can test residential supplies for lead free of charge, at a mutually agreed time, and that the company will inform UKHSA or the local authority Environmental Health Officer if it finds failures in the supply [25].
It does not state how that water should be sampled. No volume is specified, no stagnation condition, no flow condition, no sampling position, and no guidance on whether a single sample or a series should be taken.
The contrast within the same document is instructive. On paint, the guidance is detailed. It directs that all layers be collected because lead is more likely to be present in the lower ones, that substrate material be avoided as far as possible, that several samples be taken in different areas, and that sampled areas be repaired afterwards to avoid further exposure. It specifies that results be reported in mg/kg, and it explicitly rejects the units used in the United States, dust wipe sampling and chemical test kits, on the grounds that they are not comparable to or accurate against United Kingdom thresholds. It further states that environmental sampling should be undertaken by specialists who understand how to sample environmental media, prevent cross-contamination and use appropriate labelling and containers, and that public health scientists would not generally undertake the sampling themselves but would help to interpret the results [25].
That last point restates, in a public health context, the difficulty identified in Section 2 of this review. Interpretation is separated from protocol selection. The person assessing what the number means is not the person who determined what the number is a measurement of.
The joint guidance issued by the Drinking Water Inspectorate and Public Health England for health and water professionals does not close the gap. It sets out the legal framework, the notification of water quality events, the criteria for convening an incident management team, the types of precautionary notice, and the arrangements for alternative supplies. Lead appears among the regulated parameters and once among examples of specific advice to susceptible groups. The document contains no lead sampling protocol and no description of what a water company does on attending a property referred by a health protection team [29].
There is one English context in which a sampling instruction is published, and it concerns private supplies rather than public ones. Inspectorate guidance to local authorities states that when sampling is conducted at a premises, local authority samplers will take samples to test for plumbing metals including lead prior to taking any other samples, and that the local authority should seek health advice from UKHSA or Public Health Wales as part of its investigations [30]. The instruction concerns sample order rather than protocol, but it is a recognition in published guidance that the sequence in which samples are drawn affects what they represent.
The Procedure Exists and Is Not Published
It would be wrong to conclude from the above that England has no procedure. It has one, and its existence is a matter of public record.
Case notifications are referred to regional health protection teams for follow-up and action based on a national standard operating procedure for case management. The surveillance reports state that once a case is notified to a local health protection team it is assigned to a lead clinician who uses UKHSA national guidance to manage it. That guidance is cited in the reference list of the 2025 surveillance report as UKHSA (2024), Lead standard operating procedure for HPTs, and is there marked as an internal document [26,27]. The same report records that a set of documents and standardised letters developed to support child lead case management is available to practitioners through an internal duty doctors’ pack.
The position is therefore precise, and worth stating precisely. A current national procedure governs how these investigations are conducted in England. It is referenced in published documents. It is not itself published. Nothing in this review should be read as a claim about what that procedure contains or about the quality of the investigations conducted under it. What can be said is narrower and still significant: a person seeking to understand how drinking water is sampled when a child in England is found to have an elevated blood lead concentration cannot establish it from the public record.
What Scotland Publishes
Scotland has taken a different course. In November 2025, Public Health Scotland published guidance on the public health management of elevated lead levels in drinking water, intended to provide a consistent approach to investigation, risk assessment, communication and control measures [28]. The guidance contains a section devoted to water sampling, divided into sampling strategy and sampling techniques. Both sampling tables are stated to be modified from the World Health Organization technical brief cited throughout this review [24].
The first table sets out single-sample methods. Random daytime sampling is described as capturing variable stagnation times where there is no prior flushing, therefore giving variable levels, with the note that numerous random daytime samples would be required to estimate mean exposure levels. Fully flushed sampling is described as flushing the pipes completely to ensure that mains water is being sampled, with the time required influenced by the length of the supply pipes to the premises, and with the note that it can inform the lowest lead level achievable using flushing advice as a remedial action. First draw is described as flushing and then leaving the pipes unused for a longer period, for example overnight, and as potentially providing the maximum level to which consumers may be exposed. Thirty-minute stagnation is described as potentially providing a more realistic estimate of exposure.
The second table sets out multiple-sample methods. Profile or sequential sampling takes numerous samples of a defined volume after a defined stagnation time, with the note that differentiated volumes can be used to pinpoint the source better and that the method captures the lead contribution from defined parts of a plumbing system. Profile sampling for particle release repeats the exercise at increasing flow rates, capturing the particulate contribution to total lead. Composite proportional sampling collects a fixed share of every draw from the tap over a period such as a week, and is described as the best representation of exposure, although time-consuming on a larger scale.
The guidance is equally explicit that the choice is not automatic. It notes that some techniques are more resource intensive than others and that some require detailed knowledge of the plumbing system, and that site-specific factors and resource considerations will inform an agreed strategy. Where a more detailed sampling suite is required to understand the sources of lead and estimate exposure, a sampling strategy should be agreed between the agencies involved, which may include the health protection team, the local environmental health team and Scottish Water, with responsibility for collecting and paying for samples negotiated between them. Sampling should be carried out by qualified sampling officers. Analysis should be undertaken by a laboratory accredited by the United Kingdom Accreditation Service to ISO 17025. Where practical, all taps used for drinking water should be sampled, and where that is impractical, sampling should aim to be representative of potential exposure.
On source investigation, the guidance directs that the source be investigated by taking samples and observations, and notes that a non-invasive survey of accessible plumbing by a competent person, for example below the kitchen sink, can help to identify whether lead fixtures and fittings are present. It states that it is not intended to inform a full environmental investigation where sources of lead other than drinking water may be present.
Why the Divergence Matters
Set side by side, the two published positions differ not in rigour but in what they make available to the people carrying out the work.
Scotland publishes seven sampling methods, states what each one is capable of establishing, declines to prescribe any single one, and requires that a strategy be agreed before sampling begins. That is the argument of this review adopted as national guidance. It is difficult to state the principle more plainly than the guidance itself does by structuring its tables around what each method captures rather than around a standard procedure to be followed.
England publishes the trigger, the roles and the referral, and holds the method internally.
It is worth being clear about what this divergence does not show. It does not show that investigations in England are conducted poorly, nor that the internal procedure is deficient. It is not possible to form a view on a document that has not been read. What it shows is that a practitioner, a clinician or a parent in Scotland can find out what a lead sample is capable of establishing before one is taken, and the same person in England cannot.
It is also worth noting what the Scottish guidance does not do. It does not introduce a new purpose for lead sampling. Its methods serve source investigation and the estimation of exposure, both of which are among the four purposes set out in Section 13. What it does is make the protocol follow from which of them is being asked. The framework in this review is confirmed by it, not extended.
What the Surveillance Data Shows
The frequency with which drinking water is implicated in these investigations has changed recently, and the change is worth recording accurately.
The Lead Exposure in Children Surveillance System is a passive national surveillance system coordinated by UKHSA, covering children aged under 16 in England. In 2024 a total of 247 cases meeting the case definition were reported, an increase of 9% on the 226 cases recorded in 2023. Enhanced surveillance questionnaires, completed by health protection teams during case management, record the exposure sources identified. Of the 101 questionnaires completed in 2024, soil was recorded in 24% of cases, paint in 17%, and drinking water or leaded pipe sources in 12%. UKHSA notes that the proportion of cases exposed through drinking water and lead pipes doubled compared with the previous year, rising from 6% to 12% [27]. The series is shown in Figure 8. Figure 7 sets the change alongside the other recorded sources.
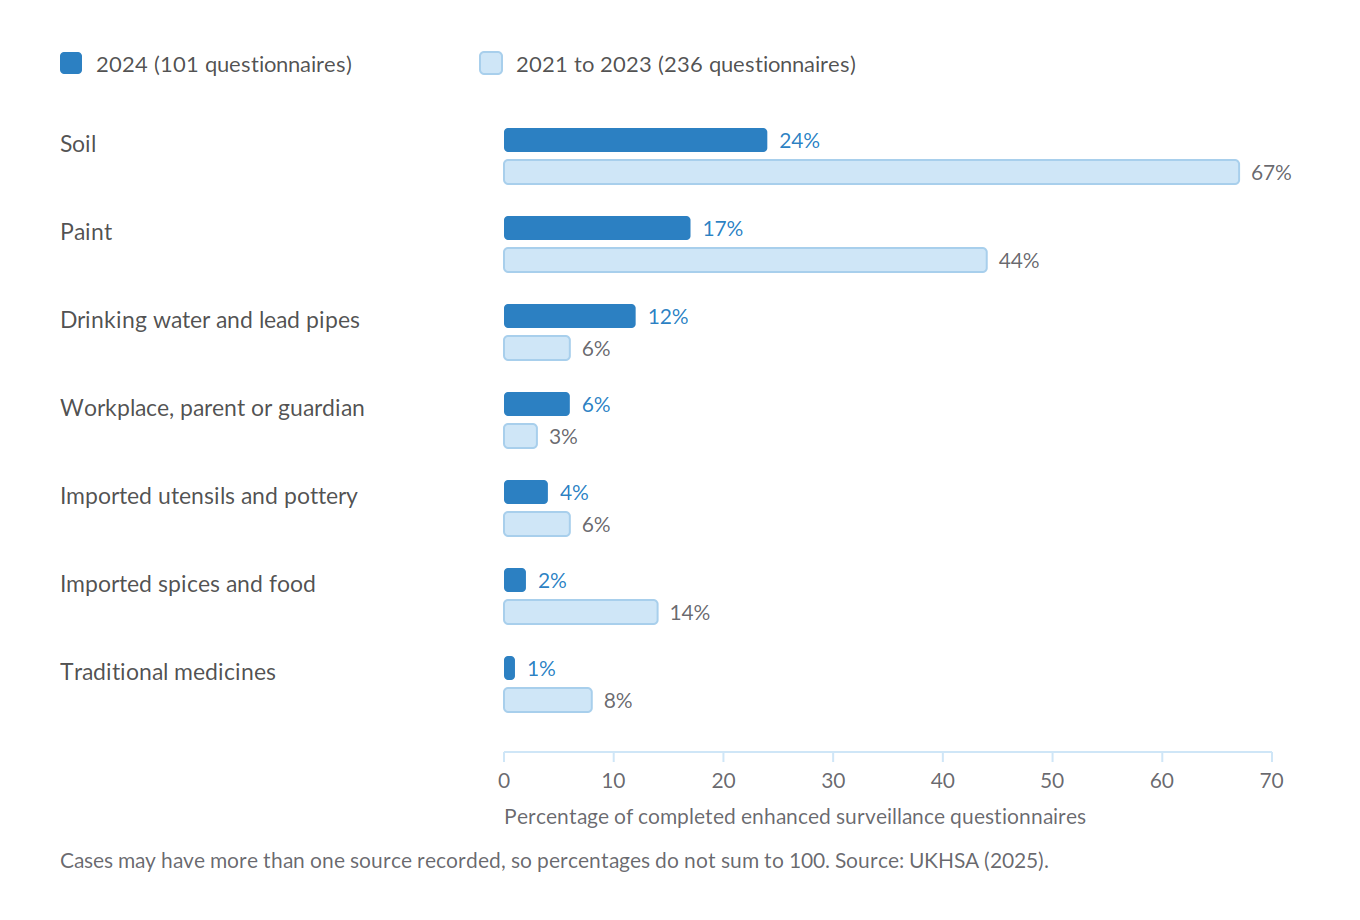
Reported sources of lead exposure among children in England, 2024 compared with 2021 to 2023. Drinking water and lead pipes is the only category to rise.
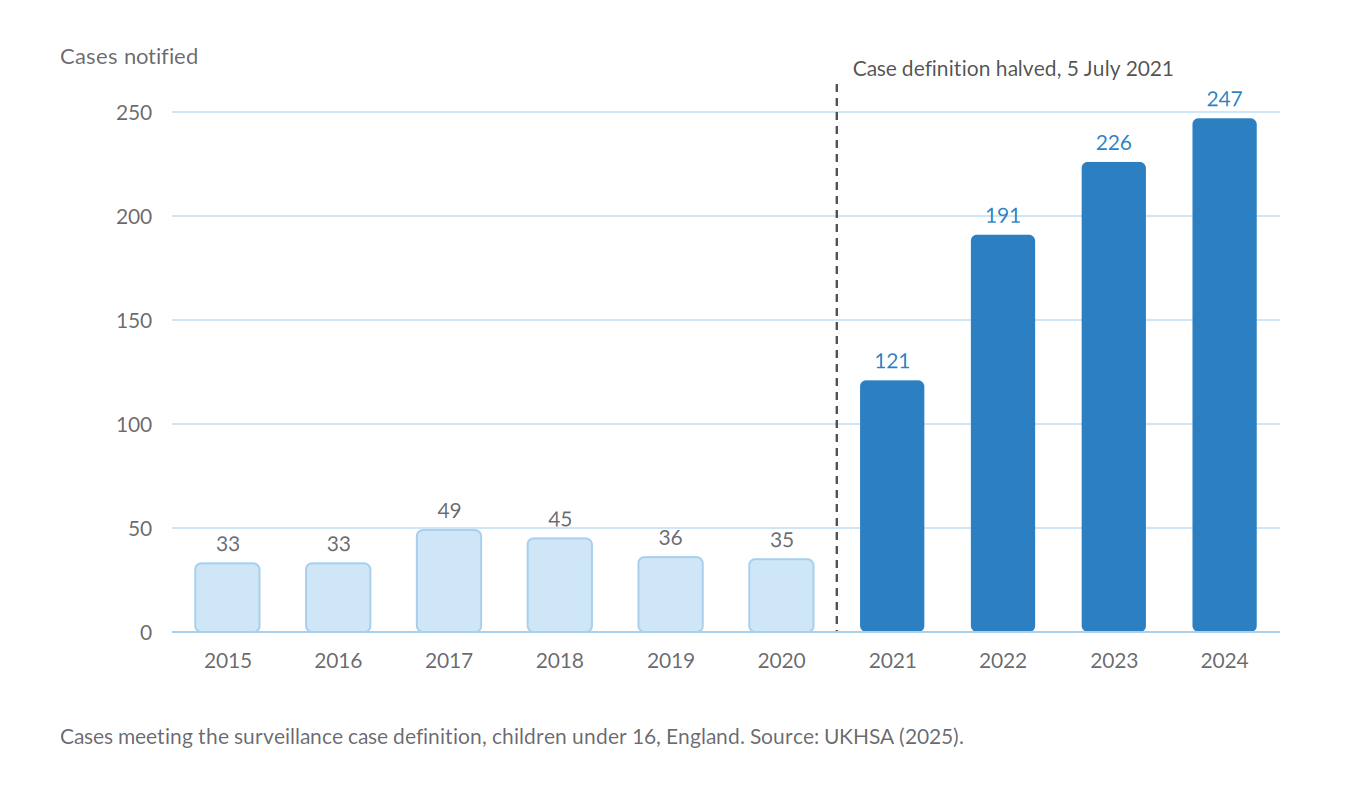
Cases of elevated blood lead in children notified to surveillance in England, 2015 to 2024. The public health intervention concentration was halved on 5 July 2021, so figures before and after that date are not directly c
Three qualifications belong alongside that figure. First, questionnaires were completed for 101 of 247 cases, so the proportions describe a subset. Second, UKHSA states directly that the number of cases reported to the surveillance system is significantly lower than the estimated incidence of lead exposure in children in England, and that regional variation in reporting reflects differences in case ascertainment rather than in incidence. Third, a single year’s movement in a proportion drawn from a small sample is not a trend.
With those qualifications stated, it remains the most recent published English figure on the contribution of drinking water to childhood lead exposure, and drinking water has moved from fifth place among recorded sources to third.
One further finding from the same source bears on the earlier sections of this review. UKHSA cites research identifying residence in terraced housing and in homes built before the 1970s as key risk factors for increased blood lead concentration in children in England [31]. The housing characteristics associated with elevated blood lead are the housing characteristics associated with lead service pipes. Whichever purpose a sample is taken for, the result travels no further than the information recorded alongside it. That is the subject of the next section.
What Information Should Accompany Every Lead Result?
A laboratory report provides the analytical concentration of lead present within the submitted sample. As this review has demonstrated, however, the concentration alone is insufficient to determine what that result actually means. Throughout the preceding sections, the interpretation of every analytical result has depended upon information that exists outside the laboratory itself: how long the water remained stagnant, how much water was collected, how rapidly it was drawn, where within the draw the sample was taken, and why the sample was collected in the first place.
Without this information, the analytical result remains scientifically correct but interpretively incomplete. The sampling record should therefore be regarded as an integral part of the evidence rather than as administrative paperwork accompanying the laboratory certificate.
Purpose of Sampling
The first piece of information should be the simplest.
Why was the sample collected?
The answer determines how the result should subsequently be interpreted.
The purpose may be:
- regulatory compliance;
- household exposure assessment;
- source identification;
- post-intervention verification;
- routine monitoring;
- complaint investigation; or
- research.
Without knowing the purpose of sampling, it is difficult to judge whether the sampling protocol was appropriate to the question being asked. Throughout this review, the central argument has been that different objectives require different sampling protocols. Recording the sampling purpose is therefore fundamental.
Where Was the Sample Collected?
The sampling location should be described precisely.
Ideally, this includes:
- the property address;
- the specific outlet sampled;
- whether the outlet was a kitchen tap, bathroom tap or another drinking-water outlet;
- whether the sample was taken before or after any treatment device; and
- any relevant observations regarding the outlet itself.
Sampling from different outlets within the same property may legitimately produce different results because different plumbing configurations contribute to each tap. The outlet therefore forms part of the evidence.
Previous Water Use and Stagnation
The hydraulic history of the sampled water should be recorded wherever practicable.
Relevant information includes:
- the stated stagnation period;
- whether the stagnation was intentional or incidental;
- known water use before sampling;
- any flushing undertaken before collection; and
- any known use of water elsewhere within the property immediately beforehand.
This information assists interpretation by describing the contact history of the sampled water. Without it, differences between apparently similar samples may be difficult to explain.
Sample Volume and Position Within the Draw
The sampling record should specify:
- the volume collected;
- whether the sample represented the first water drawn;
- whether it formed part of a sequential sampling series; and
- where within that sequence it occurred.
These details define which hydraulic volumes contributed to the sample. A first 125 mL sample, a one-litre Random Daytime Sample and the fourth bottle within a sequential profile all represent different portions of the plumbing system. Recording only the analytical concentration while omitting the sampling volume removes much of the information required to interpret the result.
Flow Conditions
Where relevant, the sampling record should describe how the sample was collected.
This may include:
- whether the tap was opened fully or partially;
- whether the flow approximated normal household use;
- whether unusually high or low flow conditions were deliberately used; and
- any observations that may have influenced particulate mobilisation.
Although precise flow measurements are not always practical during routine investigations, recording the general hydraulic conditions improves reproducibility and assists interpretation.
Plumbing Configuration
Interpretation is strengthened considerably when supported by information about the plumbing system itself.
Relevant observations may include:
- known or suspected lead communication pipes;
- private lead supply pipes;
- internal lead plumbing;
- brass fittings;
- recent plumbing work;
- water treatment devices;
- pipe replacement history; and
- any available plumbing drawings or inspection records.
This information does not replace sampling.
It provides the physical context within which sampling results can be interpreted.
Analytical Method
The analytical record should also identify how the laboratory result was obtained.
Where relevant, this includes:
- the analytical technique;
- whether the result represents total lead or filtered (dissolved) lead;
- laboratory quality assurance procedures; and
- the reporting limit or limit of quantification where appropriate.
Although these details are often contained within laboratory reports, they remain part of the evidential chain linking the sampling protocol to the reported concentration.
A Lead Result Is More Than a Number
Taken together, these observations suggest that every laboratory result should be accompanied by sufficient contextual information to allow meaningful interpretation. At a minimum, the sampling record should ideally include:
- the purpose of sampling;
- the sampling location and outlet;
- the date and time of collection;
- previous water use;
- stated stagnation period;
- sample volume;
- position within the draw;
- flow conditions;
- any flushing undertaken;
- treatment devices or filters present;
- known plumbing configuration; and
- whether the analysis represents total or dissolved lead.
Not every investigation will require every item on this list. The level of documentation should be proportionate to the purpose of the investigation. Nevertheless, the underlying principle remains the same. Without this metadata, the concentration remains analytically valid but interpretively incomplete. The laboratory certificate tells us how much lead was present in the submitted sample.
The accompanying sampling record explains what that sample actually represents. Recognising this distinction leads naturally to the final practical question considered in this review.
Rather than asking:
“Can you test my water for lead?”
a more useful question is:
“What question do we want the sample to answer?”
That is the subject of the next section.
A Better Way to Ask for a Lead Test
After examining the scientific evidence, a simple conclusion emerges. The question most people ask is often the wrong one. Consumers, building owners and even professionals frequently begin with:
“Can you test my water for lead?”
At first sight, the request appears perfectly reasonable. In reality, it is incomplete. There is no single test that can simultaneously determine regulatory compliance, estimate household exposure, identify the source of lead within a plumbing system and verify the effectiveness of remedial work. Each of those objectives requires different evidence and may therefore require a different sampling protocol.
The more useful question is not:
“Can you test my water?”
It is:
“What question do we want the sample to answer?”
Once that question has been defined, the appropriate sampling protocol follows naturally.
If the Question Is Regulatory Compliance
The objective is straightforward.
Does the drinking water comply with the statutory lead standard? In England and Wales, this question is answered using the nationally prescribed compliance-monitoring framework. The sampling protocol, analytical interpretation and regulatory response are already defined. The purpose of the sample is to determine compliance with the prescribed standard.
If the result exceeds that standard, the regulatory framework requires further investigation.
If the Question Is Household Exposure
The question changes.
What concentrations of lead are the occupants actually likely to ingest over time? This is no longer simply a compliance exercise. The sampling strategy may need to reflect patterns of water use, stagnation, flushing behaviour, occupancy and other factors influencing the water that people actually drink. The objective is not to determine whether a regulatory limit has been exceeded in one sample.
It is to understand the lead concentrations to which occupants may be exposed during normal use.
If the Question Is Source Identification
The objective changes again.
Where is the lead entering the water? Answering this question requires evidence capable of distinguishing between different potential sources within the plumbing system. Depending upon the circumstances, this may involve sequential sampling, comparative sampling, flushing experiments, inspection of plumbing materials or other investigative techniques.
The laboratory analysis remains essential.
However, it forms part of a wider diagnostic investigation rather than constituting the investigation by itself.
If the Question Is Verification
Following remedial work, another question arises.
Has the intervention actually reduced the lead contribution?
The emphasis is now on comparison.
The sampling methodology should allow meaningful interpretation of changes before and after the intervention. Maintaining comparable sampling conditions becomes particularly important if the results are to be interpreted with confidence. Again, the sampling protocol follows from the objective.
Define the Question First
These four examples illustrate a broader principle. The sampling protocol should never be selected in isolation; it should be selected because it is capable of answering the question being asked. Each protocol deliberately controls different variables because each seeks different evidence. There is therefore no universally “best” lead test — only protocols that are more or less appropriate for a particular purpose.
This applies equally to regulators, water companies, consultants, laboratories and householders.
Before deciding:
- how long water should remain stagnant;
- how much water should be collected;
- whether flushing should occur;
- how rapidly the sample should be drawn; or
- how the laboratory result should be interpreted,
one further question should be answered.
What is the investigation trying to establish? Only once that question has been defined can the sampling protocol be selected rationally. The principle is neither theoretical nor unique to lead sampling; it underpins investigation across science, engineering and public health. The question determines the protocol. The protocol determines the evidence.
Limitations of this Review
This review is concerned with the interpretation of lead concentrations in drinking water. It is not a toxicological or epidemiological review, and it makes no assessment of the health significance of any particular concentration. Where blood lead concentrations appear, in Section 18, they appear as the trigger for an investigation rather than as a subject of analysis in their own right.
No primary data were generated. Every experimental finding reported here is drawn from published work, and the review is therefore limited by what those studies chose to measure and report. Several of the most relevant sources are paywalled, and where a finding could not be verified against the original it has been omitted rather than reproduced at second hand.
The regulatory analysis is centred on England and Wales, with comparison to Northern Ireland, Scotland and the Republic of Ireland in respect of compliance monitoring only. No position is taken on public health sampling arrangements in Northern Ireland or the Republic of Ireland, neither of which has been examined. The account of the position in England is confined to what published documents state; a national procedure exists and is not in the public domain, and nothing here should be read as an assessment of its contents.
Several of the experimental sources are not British. The Flint sequential sampling work is American, the water use distribution data are Canadian, and the World Health Organization technical brief is directed primarily at resource-limited settings and includes systems, such as hand pumps, not found in United Kingdom public supply. These are cited for the mechanisms and principles they establish rather than for values transferable to British plumbing, consistent with the argument set out in Section 11.
The review does not recommend one sampling protocol over another, and no protocol examined here is presented as superior in general terms. The argument is narrower: that a protocol can only be assessed against the question it is being used to answer, and that a laboratory result carries no meaning independent of the protocol that produced it.
Conclusion — Define the Question Before Filling the Bottle
This article began with a simple laboratory result:
Lead: 8 µg/L
On its own, the result appears complete. It is numerically precise, analytically valid and readily compared with the statutory drinking water standard. Yet the evidence reviewed throughout this article demonstrates that the concentration alone is only part of the story. The laboratory has measured the lead contained within a particular bottle of water.
What that measurement means depends entirely upon how that bottle came to be filled. Was the sample collected after two hours of stagnation or sixteen? Did it represent the first 125 mL drawn from the tap, the first litre, or a later aliquot within a sequential sampling profile?
Was it collected under gentle flow or at a flow rate capable of mobilising particulate lead? Did it represent water that had remained within the tap itself, internal plumbing, a private supply pipe or a communication pipe? Each of these variables changes the evidential value of the analytical result without changing its analytical accuracy.
That distinction has been the central theme of this review. The scientific literature demonstrates that lead concentration at the tap is not a fixed property of a building. It changes with stagnation, hydraulic position, sample volume, flow conditions, previous water use and the mobilisation of particulate material. Different sampling protocols deliberately control these variables because they are designed to answer different questions.
A random daytime sample determines whether a regulatory standard has been exceeded; a first-draw sample characterises the water nearest the outlet; a sequential profile examines how concentration changes as larger hydraulic volumes pass; a flushed sample investigates another hydraulic condition again. Each is appropriate to the question it was designed to answer, and none is universally superior.
This principle is reflected in the regulatory framework itself. In England and Wales, compliance monitoring is undertaken using nationally prescribed sampling arrangements. When a compliance sample exceeds the statutory standard, however, the analytical result does not conclude the investigation. It initiates one. The regulator requires the cause to be established before appropriate remedial action can be taken.
The compliance sample answers one question; the investigation answers another. The distinction is not merely procedural. It reflects the difference between measurement and interpretation.
A laboratory certificate cannot tell us:
- whether a property contains lead pipework;
- where lead entered the sampled water;
- what concentrations occupants are routinely exposed to;
- or whether a remedial intervention has been successful.
Those conclusions require additional evidence because they are different questions. The analytical result remains essential; it is simply not sufficient on its own. Perhaps the most important implication is practical rather than scientific. People often ask:
“Can you test my water for lead?”
The evidence suggests that a better question is:
“What do we want the sample to tell us?”
Only once that question has been answered can an appropriate sampling protocol be selected. Only then can the resulting laboratory concentration be interpreted in the context for which it was obtained.
The argument no longer rests on the experimental literature alone. One United Kingdom jurisdiction has published it as national guidance, tabulating sampling methods against the questions they answer rather than prescribing a single procedure, while another holds its procedure internally. The distinction between a laboratory number and the question the protocol was designed to answer is now a matter of policy as well as of science.
For more than half a century, discussion of lead in drinking water has generally begun with the question: what was the lead concentration? The evidence reviewed here suggests that this is the second question. The first is: what question was the sampling protocol designed to answer? Only once that has been established can the analytical result be interpreted at all.
The conclusion of this article can therefore be expressed in a single sentence. A lead concentration is a measurement of a particular sample. The sampling protocol determines what that result is evidence of.
Looking Beyond the Bottle
Throughout this review, one further question has repeatedly emerged. If the sampling protocol should follow from the question, who defines the question in the first place, and on what basis? Selecting an appropriate sampling protocol requires more than choosing a bottle size or a stagnation period. It requires understanding which hazard is being investigated, where that hazard may arise within the plumbing system and what evidence is needed to determine whether it has been adequately controlled. Those are not sampling decisions. They are questions of risk assessment.
This is the role of water safety planning. The approach—systematic hazard identification, specification of control measures, verification that those controls are operating, and periodic review—is well established within public water supplies. The Drinking Water Inspectorate describes drinking water as being protected through water safety planning, providing a multi-barrier approach from source to tap, with water quality further verified through extensive sampling.
Within that framework, sampling occupies a defined position. It is not the starting point of the investigation. It is the verification step. The World Health Organization illustrates the same principle in its guidance on Water Safety in Buildings[32]. In a worked example, a lead distribution pipe is first identified as a significant hazard through structured risk assessment. Water analysis for lead is then specified as the investigation required to verify the significance of that hazard, while immediate and long-term control measures are identified separately. The question is defined before the bottle is filled.
This review has examined what lead sampling can and cannot demonstrate. The question that follows is a different one. If the sampling protocol should follow from the question, who is responsible for defining that question within a building, and how should that assessment be undertaken?
Those questions lie beyond the scope of this review, but they are the natural continuation of it. They move the discussion from sampling to risk assessment, from measuring hazards to managing them, and from interpreting laboratory results to understanding how lead risks should be identified, controlled and verified within the buildings where people actually consume drinking water.
References
Primary Research
- Cartier, C., Arnold, R.B. Jr., Triantafyllidou, S., Prévost, M. & Edwards, M. (2012a). Effect of flow rate and lead/copper pipe sequence on lead release from service lines. Water Research, 46(13), 4142–4152. https://doi.org/10.1016/j.watres.2012.05.010
- Cartier, C., Nour, S., Richer, B., Deshommes, E. & Prévost, M. (2012b). Impact of water treatment on the contribution of faucets to dissolved and particulate lead release at the tap. Water Research, 46(16), 5205–5216. https://doi.org/10.1016/j.watres.2012.07.002
- Maas, R.P., Patch, S.C., Peek, B.T. & Brown, G.M. (1992). Standardized lead leaching characteristics of twenty-one models of new faucet fixtures and instant hot water dispensers. Report 92-007. Environmental Quality Institute, University of North Carolina at Asheville.
- Doré, E., Deshommes, E., Laroche, L., Nour, S. & Prévost, M. (2019). Lead and copper release from full and partially replaced harvested lead service lines: Impact of stagnation time prior to sampling and water quality. Water Research, 150, 380–391. https://doi.org/10.1016/j.watres.2018.11.076
- Gardels, M.C. & Sorg, T.J. (1989). A laboratory study of the leaching of lead from water faucets. Journal AWWA, 81(7), 101–113. https://doi.org/10.1002/j.1551-8833.1989.tb03245.x
- Hayes, C.R. (2009). Computational modelling to investigate the sampling of lead in drinking water. Water Research, 43(10), 2647–2656.
- Hayes, C.R. & Croft, T.N. (2012). An investigation into the representativeness of random daytime sampling for lead in drinking water, using computational modelling. Journal of Water Supply: Research and Technology—AQUA, 61(3), 142–153.
- Lytle, D.A. & Schock, M.R. (2000). Impact of stagnation time on metal dissolution from plumbing materials. Journal of Water Supply: Research and Technology—AQUA, 49(5), 243–257.
- Lytle, D.A., Formal, C., Cahalan, K., Muhlen, C. & Triantafyllidou, S. (2021). The impact of sampling approach and daily water usage on lead levels measured at the tap. Water Research, 197, 117071. https://doi.org/10.1016/j.watres.2021.117071
- Lytle, D.A., Schock, M.R., Wait, K., Cahalan, K., Bosscher, V., Porter, A. & Del Toral, M. (2019). Sequential drinking water sampling as a tool for evaluating lead in Flint, Michigan. Water Research, 157, 40–54. https://doi.org/10.1016/j.watres.2019.03.042
- Triantafyllidou, S., Burkhardt, J., Tully, J., Cahalan, K., DeSantis, M., Lytle, D. & Schock, M. (2021). Variability and sampling of lead (Pb) in drinking water: Assessing potential human exposure depends on the sampling protocol. Environment International, 146, 106259. https://doi.org/10.1016/j.envint.2020.106259
United Kingdom Research
- Cardew, P.T. (2003). A method for assessing the effect of water quality changes on plumbosolvency using random daytime sampling. Water Research, 37(12), 2821–2832. https://doi.org/10.1016/S0043-1354(03)00120-9
- Cardew, P.T. (2009). Measuring the benefit of orthophosphate treatment on lead in drinking water. Journal of Water and Health, 7(1), 123–131. https://doi.org/10.2166/wh.2009.015
- Gregory, R. (1986). Galvanic Corrosion of Lead in Copper Pipework: Final Report. Report 613-S. Final report to the Department of the Environment for work carried out from December 1983 to June 1986. DoE contract PECD 7/7/711-158/83; WRc reference 9810 CLD. Available from the Drinking Water Inspectorate as DWI0017.
Regulations and Official Guidance
- The Private Water Supplies (England) Regulations 2016, SI 2016/618, regulation 12(4) (as inserted by SI 2018/707).
- The Water Supply (Water Quality) Regulations 2016, SI 2016/614, regulation 9(5) (as amended by SI 2018/706).
- The Water Supply (Water Quality) Regulations 2018, WSI 2018/647 (Wales).
- The Public Water Supplies (Scotland) Regulations 2014, SSI 2014/364, Schedule 3.
- The Water Intended for Human Consumption (Private Supplies) (Scotland) Regulations 2017, SSI 2017/282, Schedule 3, Part D.
- The Water Supply (Water Quality) Regulations (Northern Ireland) 2017, SR 2017/212.
- The Private Water Supplies Regulations (Northern Ireland) 2017, SR 2017/211.
- European Union (Drinking Water) Regulations 2017 (Ireland), SI 464/2017.
- Drinking Water Inspectorate (2023). Investigation following a breach of the lead standard on a regulation 9 private water supply. Private Water Supplies Case Study. Contains public sector information licensed under the Open Government Licence v3.0.
- World Health Organization (2022). Lead in drinking-water: health risks, monitoring and corrective actions. Technical brief. Geneva: World Health Organization. ISBN 978-92-4-002086-3.
- UK Health Security Agency (UKHSA) (2024a). Lead: environmental and public health intervention. Published 8 October 2024. Contains public sector information licensed under the Open Government Licence v3.0.
- UK Health Security Agency (2024b). Lead standard operating procedure for HPTs. Internal document, cited in the reference list of the Lead Exposure in Children Surveillance System annual report, 2025. Not published.
- UK Health Security Agency (2025). Lead Exposure in Children Surveillance System (LEICSS) annual report, 2025. Updated 22 December 2025. Applies to England. Contains public sector information licensed under the Open Government Licence v3.0.
- Public Health Scotland (2025). Public health management of elevated lead levels in drinking water. Version 1.0, published 5 November 2025. Contains public sector information licensed under the Open Government Licence v3.0.
- Drinking Water Inspectorate (DWI) and Public Health England (PHE) (2021). Drinking Water Safety: Guidance to Health and Water Professionals. England, February 2021, version 1.1. ISBN 978-1-911087-30-4.
- Drinking Water Inspectorate (n.d.). Lead in private water supplies. Guidance to local authorities on specific parameters.
- Crabbe, H., Close, R., Barlow, S. and others (2022). As safe as houses: the risk of childhood lead exposure from housing in England and implications for public health. BMC Public Health, 22(1), 2052.
United Kingdom Public Health Guidance
- World Health Organization (WHO) (2011). Water Safety in Buildings.
Disclosure
This article is published by London & Surrey Water Services Ltd, a CIPHE member and WaterSafe registered contractor whose business includes lead pipe replacement. The company therefore has a commercial interest in the subject matter. The article is restricted to findings and positions reported in the sources cited, and no claim is made here that is not traceable to those sources. It is not medical advice. Readers concerned about lead exposure should speak to their GP, and readers concerned about lead in their own water supply should contact their water supplier or seek independent laboratory testing.